Showing posts with label snow. Show all posts

Friday, December 30, 2022

How much and how often does it snow in Victoria?

Victoria gets less snow than any other city in Canada.  The 30-year (1991-2020) average annual snowfall for Victoria is 16 cm.  That's significantly less than nearby Vancouver, which receives an annual average of 34 cm, as measured at the Vancouver Airport.  

The core area of Greater Victoria also gets significantly less snow than outlying areas such as Langford or the Saanich Peninsula.  The Victoria Airport, located 25 km north of Victoria, averages 34.8 cm of snow annually - more than double what the City receives.  It's quite common for there to be snow in the Westshore or the Saanich Peninsula, while there is little or no snow in the core area.  This is due to the generally milder temperatures near the Strait of Juan de Fuca and the lower precipitation amounts in the core thanks to the Olympic Mountain rainshadow.

The table below summarizes the average snowfall and snow cover (days with at least 2 cm of snow on the ground) in Victoria, by month.  December has the highest amount of snowfall (6.3 cm), although both December and January have on average, a similar number of days with snow on the ground (1.2-1.3 days).


While the table above shows the 30-year averages for snow in Victoria, there is a lot of variability from year to year.  The chart below shows the annual winter snowfall over the past century.  The chart shows 3 years (1949/50, 1968/69, and 1996/97) when Victoria received more than 100 cm of snow.  In fact, the snowiest winter on record for Victoria was 1915/16 (not shown on the chart) when Victoria received an astonishing 195.6 cm of snow!  On the other hand, there have been 7 winters in the past 125 years (6%) with no snow, and 33 winters (26%) with less than 5 cm of snow.  

The chart also shows the rolling 30-year average snowfall and 30-year median snowfall (starting with the 30-year period from 1898/99 to 1927/28 and finishing with the most recent 30-year period of 1993/94 to 2022/23).  Because the average snowfall tends to be skewed by the occasional large snowfall, the median snowfall (11.5 cm for 1991-2020) is lower than the average snowfall (16.0 cm). 


Even the 30-year average snowfall has fluctuated significantly over time.  From a low point of 19.9 cm for 1918/19 to 1947/48, the 30-year average snowfall reached a high point of 37.5 cm for 1946/47 to 1975/76.  Since then, average snowfall has generally been decreasing, with climate change likely contributing to this trend.  For the most recent 30-year period (1992/93 to 2021/22), snowfall averaged 17.4 cm (slightly higher than the 1991-2020 average).  

The chart below shows the trend in number of days annually with at least 2 cm of snow on the ground.  Snow on the ground has only been measured in Victoria since 1955, so the period of record is shorter.  As with snowfall totals, the days with snow on the ground varies considerably from year to year.  In 19 of the past 68 winters (28%), there have been no days with 2 cm or more snow on the ground.  On the other extreme, there have been 4 winters with more than 15 days with snow on the ground - including one winter (1968/69) when there was 30 days with snow on the ground!  The average number of days with snow on the ground has generally decreased over time, from about 5 days for the 1955/56 to 1984/85 period down to about 3.8 days for the most recent 30-year period (1992/93 to 2021/22), which again was slightly higher than the 1991-2020 average.


Another way to look at the snowfall data is to use quintiles.

  • The bottom quintile (the 20% of winters with the least snowfall) had an average snowfall of 1.2 cm and 0 days with snow on the ground.

  • The next quintile averaged 7.3 cm of snow and 0.7 days with snow on the ground.

  • The middle quintile averaged 16.5 cm of snow and 3.0 days with snow on the ground.

  • The next quintile averaged 30.3 cm of snow and 5.4 days with snow on the ground.

  • The top quintile (the 20% of winters with the most snowfall) had an average of 73.9 cm of snow and 15.2 days with snow on the ground.

You sometimes here about a big snow storm in another city dumping "a month's worth of snow" in a day or two.  Because snow is so infrequent in Victoria, it's not only very common to get a month's worth of snow all at once, but it's also common to get a full season's worth of snow in one storm.  For example, over the past 30 years, Victoria has received 76% of its total winter snowfall in a single two-day period.  During nearly one third of those years, Victoria received more than 95% of its seasonal snowfall in a single storm.

Other locations in the region have also seen a decline in average snowfall over the past few decades.  The chart below compares the trend in 30-year average snowfall in Victoria with other nearby locations (starting with the 30-year period from 1941/42 to 1970/71 and ending in the most recent 30-year period of 1993/94 to 2022/23).  All the locations have declined over this period.  Average snowfall levels in Victoria have trended quite closely to the pattern for Seattle.  By contrast, the Victoria Airport (in North Saanich) and the Vancouver Airport have significantly higher average snowfall levels, but they have also followed a declining trend.  


Wednesday, December 18, 2019

What are the chances of a White Christmas in Victoria?

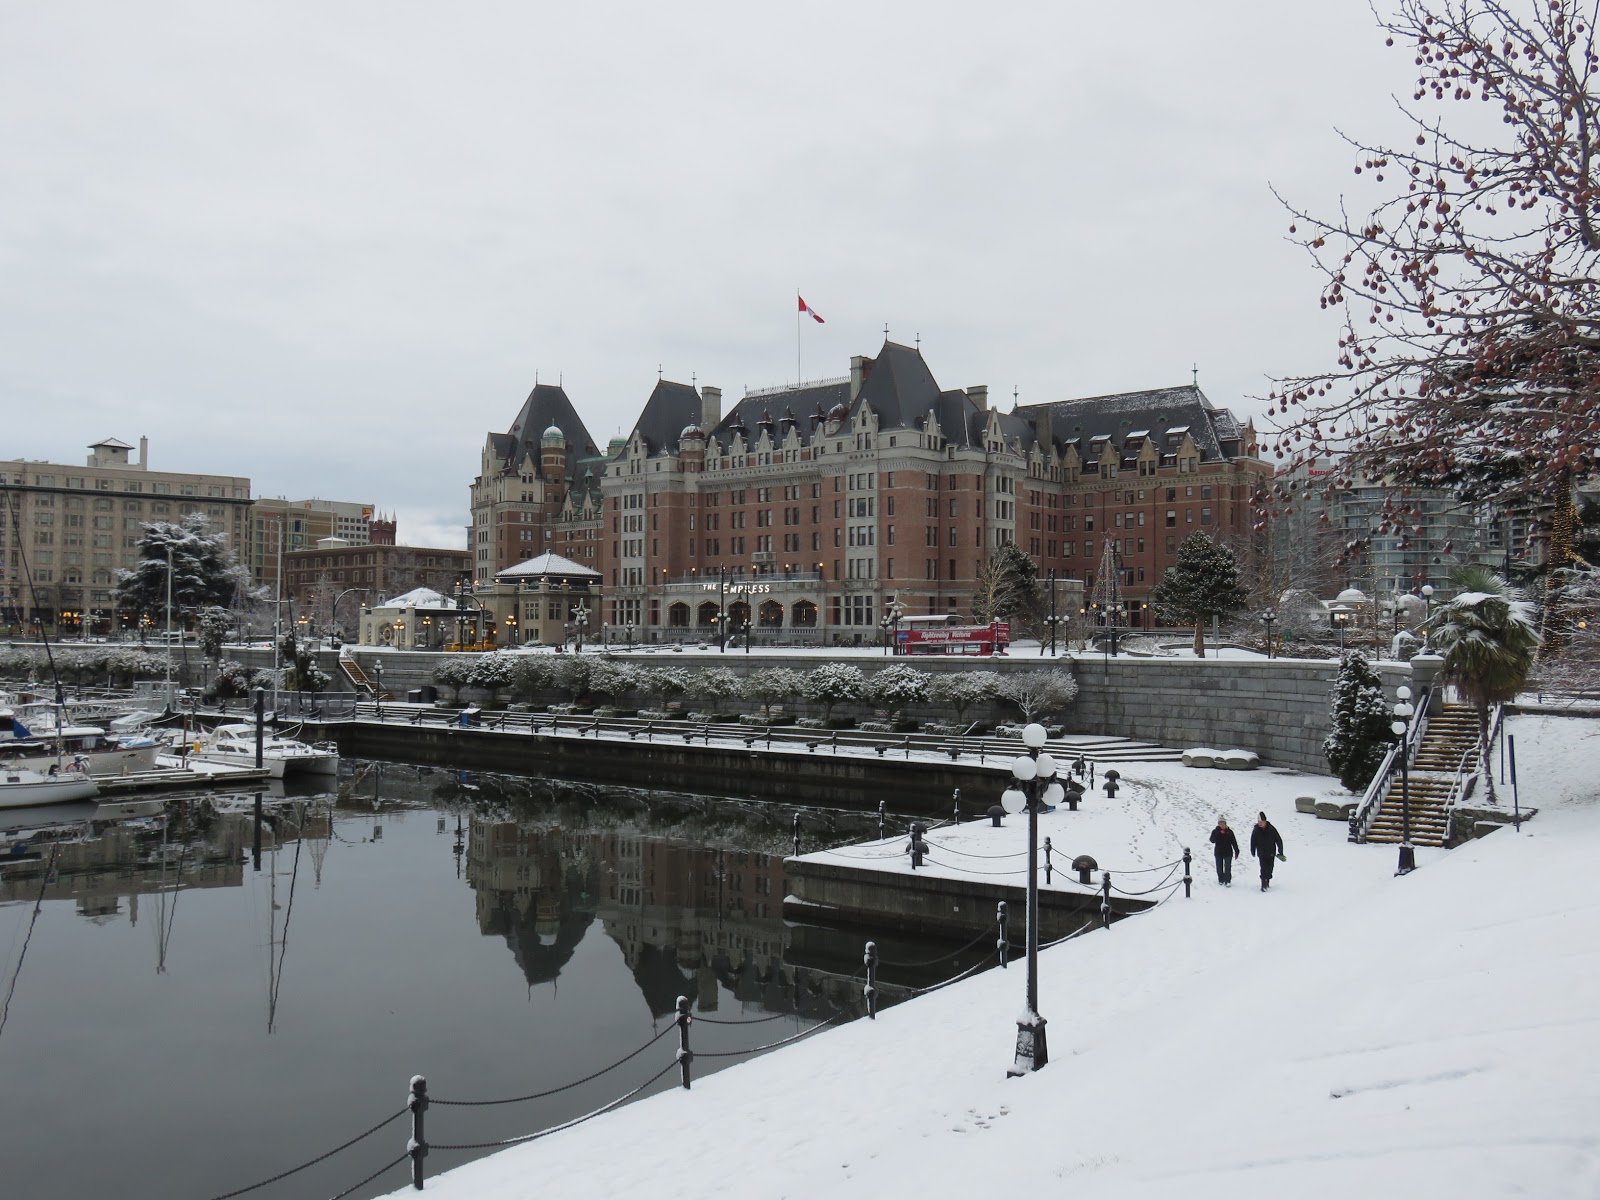
It's just one week until Christmas, so the long range forecast is accurate enough to know that the chances for a White Christmas this year in Victoria are virtually nil.  The photo below was taken on the last White Christmas in Victoria, not long ago in 2017.  It won't look like that this year.


So what is the historical likelihood of having a White Christmas in Victoria?  Environment Canada defines a White Christmas as having 2 cm or more of snow on the ground on Christmas morning.  Using that definition, there have been just 6 White Christmases in Victoria since 1914 when the Victoria Gonzales weather station opened: 1937, 1971, 1990, 1996, 2008, and 2017.  So 6 out of the last 106 years have seen snow on the ground on Christmas morning, meaning that over that period there has been a 5.7% chance of having a White Christmas.

Interestingly, the frequency of White Christmases in Victoria has actually increased in recent years.  Prior to 1990, there were just 2 White Christmases in the 76 years from 1914 to 1989 - that's just a 2.6% chance.  But in the last 30 years (1990-2019), there have been 4 White Christmases, resulting in a 13.3% chance.  Amazingly, White Christmases have been have been more than 5 times as frequent in Victoria over the past 30 years than they were in the previous 76 years!  What's even more surprising, is that this has happened as the overall amount of snowfall in Victoria has decreased: from 1914 to 1989 average annual snowfall at Victoria Gonzales was 29.9 cm, while from 1990-2019 the average annual snowfall in Victoria was just 16.4 cm.  So why has the frequency of White Christmases increased?  It's really just up to random chance - the very infrequent snowfalls that we get in Victoria have just happened to occur at or just before December 25, giving us White Christmases.  2017 was a good example of that fortuitous timing of Christmas snow: it snowed overnight on Christmas Eve, providing a White Christmas, but it was melting by evening and all gone by Boxing Day.

Victoria averages 4.7 days per year with 2 cm or more of snow on the ground.  On any given day between November 1 and March 31, there is a 3.1% chance of having snow on the ground.  This likelihood peaks during the last 10 days of December and the first 10 days of January, as shown in the chart below.  During that 20-day period, which includes Christmas, the chance of having snow on the ground ranges between 6% and 9%.

Average Frequency of Snow on the Ground in Victoria (1955-2019)


How does Victoria compare with other locations Canada?  The chart below compares the of having a White Christmas for several cities across Canada.  To make the comparison, I have used the 1955-2019 period, for which data is readily available for a number of locations.  In Victoria, there were 5 White Christmases during this 65-year period, resulting in a 7.7% chance.  Vancouver had 6 White Christmases during this period, or a 9.2% frequency.  As shown in the chart, other Canadian cities have significantly higher chances of a White Christmas: in Toronto it's 47%, while Calgary and Halifax have a 56-58% chance.  White Christmases are almost assured in most other major Canadian cities, ranging from 75% in Montreal to 98% in Winnipeg.

Chance of a White Christmas for Selected Canadian Cities
Given that Vancouver averages 8.6 days per year with at least 2 cm of snow on the ground versus 4.7 days for Victoria, it's surprising that the chance of a White Christmas isn't much greater in Vancouver.  Again, this seems to come down to random chance.  While Vancouver only had one more White Christmas during the 1955-2019 period compared with Victoria, those White Christmases have been much snowier in Vancouver.  For Victoria's 5 White Christmases, the average snow depth was 7 cm, while for Vancouver's 6 White Christmases, the average snow depth was 20 cm.

So if White Christmases are pretty rare in Victoria, what does the weather typically look like on Christmas Day?  Based on the 30-year "normals", the average high temperature is 6.8 C while the average low is 3.1 C.  The daytime high on Christmas Day in Victoria is between 5 C and 10 C 67% of the time; it's between 0 C and 5 C 23% of the time and between 10 C and 15 C 10% of the time.

On average, Victoria gets 2.6 mm of rain on Christmas Day, although there has only been measurable rain on 51% of Christmases.  The wettest Christmas Day was 1972, with 51 mm of rainfall.  Meanwhile, Victoria averages 2.4 hours of sunshine on Christmas Day, or about 30% of the 8 hours that is possible on December 25.  There has been at least some measurable sunshine on Christmas 63% of the time, so Victoria is more likely to get at least some sunshine on Christmas Day than to get some measurable rain.


Sunday, March 5, 2017

Victoria's cold winter of 2016-17

We've recently come to the end of meteorological winter (December 1 to February 28), and it was definitely an unusual winter in Victoria.  The biggest stand out was the temperature - this past winter was the coldest in 38 years in Victoria.  The last time we had a winter this cold was back in 1978-79.  Victoria has actually experienced 20 winters in the last 120 years that were at least this cold.  However, all of those winters were prior to 1980, so we're just not used to it  any more!

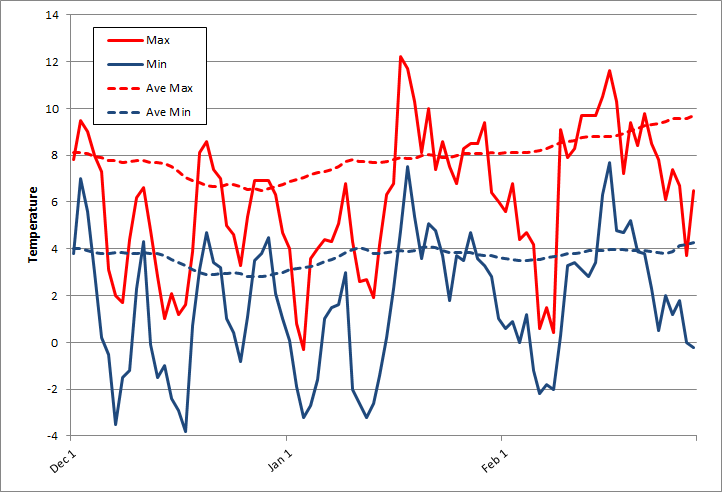
The mean temperature this past winter was 3.9 degrees, roughly 2 degrees below the 30-year average of 5.8 degrees.  The average daily maximum/minimum this winter was 6.1/1.6, again roughly 2 degrees below the normal winter daily max/min of 7.9/3.6. 

The chart below compares the daily maximum and minimum temperatures this winter with the 30-year average temperatures.  You can see that the temperatures were pretty consistently below average, with just a couple of brief spells of milder weather. 

Daily maximum & minimum temperatures in Victoria, winter 2016-17


Victoria experienced 25 days when the temperature dropped below freezing this winter, compared with the average of 8.8 days.  Again, that’s the most days since the winter of 1978/79.  However, the record was 41 days in 1912/13.  While we had a lot of overnight lows below freezing, it never really got that cold in Victoria this winter.  The coldest temperature was -3.8 degrees on December 17.

Conversely, Victoria experienced daytime temperatures above 10 degrees on just 7 days this winter, compared with the average of 20 days.  Last winter (2015/16) there were 28 days above 10 degrees and the winter before that (2014/15) there were 42 such days - six times as many as this winter.  To put it another way, just 8% of winter days this year were above 10 degrees, compared with 47% of winter days in 2014/15.   

The colder weather was partly the result of a number of arctic outbreaks, bringing cold sunny weather to Victoria.  As a result, total precipitation for the winter was below normal: 222 mm versus the 30-year average of 264 mm.  The chart below compares the daily and cumulative precipitation at Victoria Gonzales this past winter with the 30-year normal precipitation.  While December was a bit wetter than normal, January was very dry and February was about average.  The highest daily rainfall was 26 mm on February 9.  Overall, there were 46 days with measurable precipitation this winter, which was right on the average.

Daily & cumulative precipitation in Victoria, winter 2016-17


As usual, Victoria was much drier than surrounding areas, as shown in the chart below.  Compared with Victoria Gonzales (222 mm), the Victoria Airport (315 mm) had 50% more precipitation, while Seattle (430 mm) and Vancouver (469 mm) both had about twice as much. 


Winter 2016/17 brought the first significant snowfall in 5 years to Victoria.  Not surprisingly, snowfall was above normal.  Total snowfall for the winter was 29 cm, almost double the 30-year average of 16 cm for December to February (total annual snowfall averages 20 cm in Victoria).  There was 8 cm of snow in December, just 1 cm of snow in January, and a whopping 20 cm in February (versus normal of 9 cm for December, 3.4 cm for January, and 3.6 cm for February). In terms of days with snow on the ground, Victoria got off not too badly (especially compared with Vancouver and up-Island): there were 5 days with at least 1 cm of snow on the ground this winter compared with the normal of 4.5 days during December to February.

Friday, August 26, 2016

Which has a better climate - Victoria or Calgary

Our climate smackdown series continues.  We have already compared Victoria's climate with Vancouver and Toronto.  This time we'll look at Calgary.  

Let's start with precipitation.  On an annual basis, Calgary gets about 35%  less precipitation than Victoria - 419 mm in Calgary versus 641 mm in Victoria.    If you split that into rain and snow, Calgary gets barely half as much rain as Victoria (326 mm vs. 621 mm) but Calgary gets about six and a half times as much snow (129 cm vs. 20 cm).  

Calgary also greatly differs from Victoria in the seasonal pattern of its precipitation.  Victoria gets most of its rain in late fall and winter, while the late spring and summer is very dry.  In Calgary, the precipitation pattern is the opposite of this, with a very dry late fall and winter, but a decidedly wet late spring and summer.  You can see the difference in the chart below.  The driest six months in Victoria occur during the growing season, from April to September, with a total of just 137 mm, or 21% of the annual total during that period.  By contrast, April to September are the wettest six months of the year in Calgary, with 344 mm or about 82% of the annual total 
(and two and half times as much rain as Victoria gets during the growing season).   During Victoria's wettest months, in November, December, and January, it gets about ten times as much precipitation as Calgary, but during the dry summer months of June, July, and August, Calgary gets four to five times as much rain as Victoria.  While Victoria gets more annual precipitation than Calgary, Victoria, on average, is drier than Calgary during five months; May, June, July, August, and September,  One of the big reasons for the much drier summers in Victoria is the lack of thunderstorms: Calgary averages about 27 days annually with thunderstorms - nearly all between May and August - compared with about one day per year in Victoria.


We can also compare the frequency of precipitation.  For example, Victoria averages 133 days per year with measurable precipitation versus 112 days in Calgary. The chart below compares the % chance of measurable precipitation on any given day throughout the year.  There is much more seasonal variation in Victoria, ranging from 60% chance during November and December to a 10% chance in late July and early August.  The likelihood of precipitation has a smaller seasonal range in Calgary, from about 20% in November and December up to about 45% in June.  The chance of having a day with measurable rainfall is lower in Victoria from late April until mid-September.  From late-July until mid-August, Calgary is more than three times as likely as Victoria to get a rainy day.  During November and December, the reverse is true, with Victoria about three times as likely to get a day with precipitation compared with Calgary.


As noted earlier, Calgary gets more than 6 times as much snow as Victoria, with an average 129 cm annually in Calgary versus 20 cm in Victoria.  Snow also stays on the ground much longer in Calgary, with an average of 86 days each winter with at least 1 cm of snow on the ground compared with 5 days for Victoria.  Although on average, Victoria gets much less snow, it has had more really large snowfalls than Calgary.  The biggest one-day snowfall in  Calgary in the past 100 years was 48 cm in May 1981.  In Victoria, there have been three one-day snowfalls that exceeded 50 cm, in February 1916, February 1923, and December 1996.  

Calgary does beat Victoria in terms of sunshine, with an average 2,396 hours of sunshine annually, nearly 9% more sunshine than Victoria's 2,203 hours.  Victoria averages 315 days per year with at least some measurable sunshine; Calgary gets 333 such days.  Looking at the flip side, Victoria averages 50 days each year with no measurable sunshine while Calgary averages just 32 such days.  While Calgary gets more sunshine than Victoria on an annual basis, there are some important seasonal variations, as was the case with precipitation.  The chart below shows the % of possible sunshine, by month, throughout the year.  Victoria gets a much lower percentage of possible sunshine than Calgary during the winter months.  In December, for example, Victoria gets just 26% of possible sunshine hours while Calgary gets 46%.  However, from May through September Victoria gets a higher percentage of possible sunshine than Calgary.  Victoria's summer sunshine advantage peaks in July,  when it's sunny 69% of the time in Victoria compared with about 63% in Calgary. 


Now let's compare temperature.  Calgary, of course, has much colder winters, and it also has a  much greater seasonal variation in temperature compared with Victoria.  The chart below shows the average daily maximum temperature in Victoria versus Calgary.   Average maximum temperatures in Victoria range from 7 degrees in December to 21 degrees in July - a difference of about 14 degrees.   In contrast, maximum temperatures in Calgary range from -4 degrees in January to 25 degrees in July - a range of 29 degrees, or more than twice the range experienced in Victoria.  The average daily maximum temperature is warmer in Victoria from the beginning of September until mid-May.  The greatest difference is in  late January, when the average daily maximum is nearly 12 degrees warmer in Victoria compared with Calgary.  In contrast, in July the average daily maximum temperature is 3.5 degrees cooler in Victoria compared with Calgary.  (It should be noted that the numbers for Victoria are based on Victoria Gonzales, located right on the Strait of Juan de Fuca.  Away from the Strait, at the University of Victoria, the average high temperature in July is 23.8 degrees, nearly 3 degrees warmer than Gonzales and about the same as Calgary).  


The record maximum  temperature for Victoria is 36.0 degrees versus 36.1 degrees for Calgary.  Calgary gets an average of 87 days per year above 20 degrees and 5 days above 30 degrees.  In contrast, Victoria gets an average of just 50 days per year above 20 degrees and 1 day per year above 30 degrees.  Again, if you measure the temperature away from the Strait of Juan de Fuca (at the University of Victoria), it's more like 95 days above 20 degrees and 3 days above 30 degrees.  

The next chart shows average daily overnight low temperatures in Victoria versus Calgary.  Compared with Victoria, average overnight lows are cooler in Calgary throughout the year.  However, there is a much greater seasonal variation in Calgary, so there is a much greater difference between Victoria and Calgary in the winter.  Overnight temperatures range from about 3 degrees cooler than Victoria in the summer down to nearly 20 degrees colder than Victoria in the winter.  In Calgary, average overnight lows are below 0 from the mid-October until the end of April, and Calgary averages a whopping 194 days per year with overnight lows below freezing.  Victoria averages less than 10 such "frost days" per year.  


The coldest temperature ever recorded in Victoria was -15.6 degrees in December 1968.  On the other hand, Victoria has experienced 7 winters in the past 118 years when the temperature did not drop below freezing.  The coldest temperature recorded during the winter of 1925-26 was +1.1 degrees, making it the highest low temperature for any winter on record.  In Calgary, the lowest temperature ever recorded was -45 degrees.  The highest low temperature for any winter in Calgary was -22 degrees during the winter of 1986/87.  In Victoria, the average coldest temperature each winter is -4.8 degrees, while the average winter low temperature for Calgary is -34 degrees.  

So who wins the climate smackdown?  I think Victoria clearly wins in terms of temperatures.  While summer high temperatures are a little cooler in Victoria (at least near the water), Calgary is much colder in the winter, and overnight temperatures are colder in Calgary throughout the year.  On an annual basis, Calgary is drier and sunnier than Victoria (although Calgary gets much more snow).  However, during the warmer late-spring and summer months, Victoria actually gets less rain and more sunshine than Calgary.  While Victoria is much wetter and cloudier during the winter months compared with Calgary, it is also much warmer.  While the definition of best climate is subjective, I think Victoria wins this showdown: it has a sunnier, drier summer than Calgary and, in my opinion, a cloudier and wetter winter is a worthwhile trade-off for Victoria's much milder winter temperatures, 

Saturday, March 26, 2016

Which has a better climate - Victoria or Toronto?

Our climate smackdown series continues.  Next we'll compare Victoria's climate to Toronto's.  All the numbers below are based on stats for Victoria Gonzales and for Toronto City (not Airport numbers).  

Let's start with precipitation.  On an annual basis, Toronto gets about 30%  more precipitation than Victoria - 831 mm in Toronto versus 641 mm in Victoria.    If you split that into rain and snow, Toronto gets about 20% more rain than Victoria (741 mm vs. 621 mm) and about 6 times as much snow (122 cm vs. 20 cm).  

Besides getting more precipitation, Toronto also differs from Victoria in the seasonal pattern of its precipitation.  While Victoria has a very distinct rainy season (late fall and winter) and dry season (late spring and summer), precipitation in Toronto is more or less the same year round.  You can see the difference in the chart below.  Victoria gets about 50% more precipitation than Toronto in November, December, and January (318 mm vs. 207 mm).  Precipitation levels are about the same in both cities during the transitional months of February and March, and again in October. During the six months from April to September, Victoria gets less than one third as much rain as Toronto (137 mm vs. 451 mm).  The difference is particularly pronounced during June, July, and August when Victoria gets less than one quarter as much rain as Toronto.  One of the big reasons for the much drier summers is the lack of thunderstorms in Victoria: Toronto averages about 28 days annually with thunderstorms compared with about one day in Victoria.


We can also compare the frequency of precipitation.  For example, Victoria averages 133 days per year with measurable precipitation versus 145 days in Toronto. The chart below compares the % chance of measurable precipitation on any given day throughout the year.  Again, you can see there is much more seasonal variation in Victoria, ranging from 60% chance during November and December to a 10% chance in late July and early August.  The likelihood of precipitation has a much smaller seasonal range in Toronto, from about 50% in the winter down to about 30% in late summer.  The chance of having a day with measurable rainfall is lower in Victoria from early April until early October.  The gap is especially wide from mid-July until mid-August: if you're planning an outdoor event at this time of year it's about three times as likely to get rained out in Toronto compared with Victoria. 


As noted earlier, Toronto gets more than 6 times as much snow as Victoria, with an average 122 cm annually in Toronto versus 20 cm in Victoria.  Snow also stays on the ground much longer in Toronto, with an average of 68 days each winter with at least 1 cm of snow on the ground compared with 5 days for Victoria.  Although on average, Victoria gets much less snow, it has had more really large snowfalls than Toronto.  The biggest one-day snowfall in Toronto in the past 100 years was 48 cm in December 1943.  In Victoria, there have been three one-day snowfalls that exceeded 50 cm, in February 1916, February 1923, and December 1996.  

Victoria is also sunnier than Toronto, with an average 2,203 hours of sunshine annually versus 2,066 hours for Toronto.  Victoria averages 315 days per year with at least some measurable sunshine, leaving an average 50 days per year with no sun.  Toronto averages 60 days annually with no measurable sunshine.  The chart below shows the % of possible sunshine, by month, throughout the year.  Victoria gets a slightly lower percentage of possible sunshine than Toronto during the winter, from December until March.  However, from April to October Victoria gets a higher percentage of possible sunshine.  The difference is especially noticeable in July and August, when it's sunny nearly 70% of the time in Victoria compared with about 58% in Toronto. 


Now let's compare temperature.  While Victoria has  much greater seasonal variation in precipitation and sunshine compared with Toronto, the opposite is true for temperature.  The chart below shows the average daily maximum temperature in Victoria versus Toronto.   Average maximum temperatures in Victoria range from 7 degrees in December to 21 degrees in July - a difference of about 14 degrees.   In contrast, maximum temperatures in Toronto range from -2 degrees in January to 27 degrees in July - a range of 29 degrees, or more than twice the range experienced in Victoria.  The average daily maximum temperature is warmer in Victoria for half the year, from mid-April to mid-October.  The greatest difference is in mid-January, when the average daily maximum is nearly 10 degrees warmer in Victoria compared with Toronto.  In contrast, in July the average daily maximum temperature is 6 degrees cooler in Victoria compared with Toronto.  (It should be noted that the numbers for Victoria are based on Victoria Gonzales, located right on the Strait of Juan de Fuca.  Away from the Strait, at the University of Victoria, the average high temperature in July is 23.8 degrees, nearly 3 degrees warmer than Gonzales).  


The next chart shows average daily overnight low temperatures in Victoria versus Toronto.  The pattern is very similar to the daily high temperatures discussed above: there is a much greater seasonal range in Toronto, with average overnight lows ranging from -8 degrees in January to nearly 19 degrees in July (a 27 degree range).  In Victoria, overnight lows range from 3 degrees in December to 12 degrees in August (a 9 degree range, only one third of the range in Toronto).  Average overnight lows in Victoria exceed those in Toronto for an even longer period than the daytime highs do, from early October to early May.  In Toronto, average overnight lows are below 0 from the beginning of December to the end of March, and Toronto averages 101 days per year with overnight lows below freezing.  Victoria averages less than 10 such "frost days" per year.  


The coldest temperature ever recorded in Victoria was -15.6 degrees in December 1968.  On the other hand, Victoria has experienced 7 winters in the past 118 years when the temperature did not drop below freezing.  The coldest temperature recorded during the winter of 1925-26 was +1.1 degrees, making it the highest low temperature for any winter on record.  In Toronto, the lowest temperature ever recorded was -32.8 degrees.  The highest low temperature for any winter in Toronto was -13.1 degrees during the winter of 2005/06.  In Victoria, the average coldest temperature each winter is -4.8 degrees, while the average winter low temperature for Toronto is -20 degrees.  

The record maximum  temperature for Victoria is 36.0 degrees versus 40.6 degrees for Toronto.  Toronto gets an average of 50 days per year above 25 degrees and 13 days above 30 degrees.  In contrast, Victoria gets an average of just 8 days per year above 25 degrees and 1 day per year above 30 degrees.  Again, if you measure the temperature away from the Strait of Juan de Fuca (at the University of Victoria), it's more like 27 days above 25 degrees and 3 days above 30 degrees.  Either way, Victoria's summers are much cooler than Toronto's - and no humidity!

So who wins the climate smackdown?  I think it's pretty clear that Victoria wins in terms of more sunshine, less rain, and much less snow.  It also wins for having much milder winters.  However, the summer temperatures are more subjective.  Being a Victoria native, I love the cool summers here, but I know that some people prefer the heat in the summer.  Give me cool, dry and sunny over hot and muggy any day, although it would be nice to have a few more warmer summer evenings in Victoria!  Overall, I still have to give this one to Victoria.

Saturday, February 13, 2016

February blahs? Not in Victoria!

You often hear the term February blahs, especially from people in other parts of Canada who are tired of the cold, snow and slush, and they know that they probably have a couple more months of winter to endure.  I think this is the time of year when I am most appreciative of living in Victoria.  This may not be the nicest time of year in Victoria, but compared with most of the rest of Canada, it is heaven.  (It was -26 degrees in Toronto this morning, although granted that is very cold even for them!)


versus


As I mentioned in this post, while February is still the depth of winter in many parts of Canada, the coldest and dreariest point of the winter in Victoria tends to happen quite early, around the end of December.  By February, the weather is noticeably warmer, drier, and sunnier.  The average high temperature in February in Victoria is 9 degrees, a degree warmer than January and nearly two degrees warmer than December.

February is also noticeably drier, with an average of just 61 mm of precipitation compared with more than 100 mm each month in November, December, and January - the end of the rainy season is definitely in sight!  On average, there is a 43% chance of measurable precipitation on any given day in February (compared with than 50% in November, December, and January).  As I've said before, I think looking at the % chance of rain on any given day somewhat overstates how rainy it is, since a day with measurable precipitation doesn't necessarily mean rain all day - it could be a brief shower.  Another way to look at at this is the % of hours with measurable precipitation, and for Victoria in February there is precipitation just 19% of the time.

The sun is also making more of an appearance, with 98 hours of sunshine in a typical February in Victoria.  That works out to an average of 3.5 hours per day, compared with only 2.3 hours per day in January and 2.0 hours per day in December.  On average, February gets 22 days with at least some measurable sunshine, and overall, it is sunny about 35% of the time (at least during daylight hours!).  In other words, during daylight hours it's actually more likely for the sun to be shining February (35% of the time) than it is to be raining (19% of the time).

Snow is also pretty rare in February in Victoria.  Over the past 30 years, only 11 Februarys have seen any snow at all and just 5 of the past 30 Februarys saw significant snowfall (more than 10 cm).  When it does snow, it melts quickly; Victoria averages just 0.7 days with snow on the ground during February.

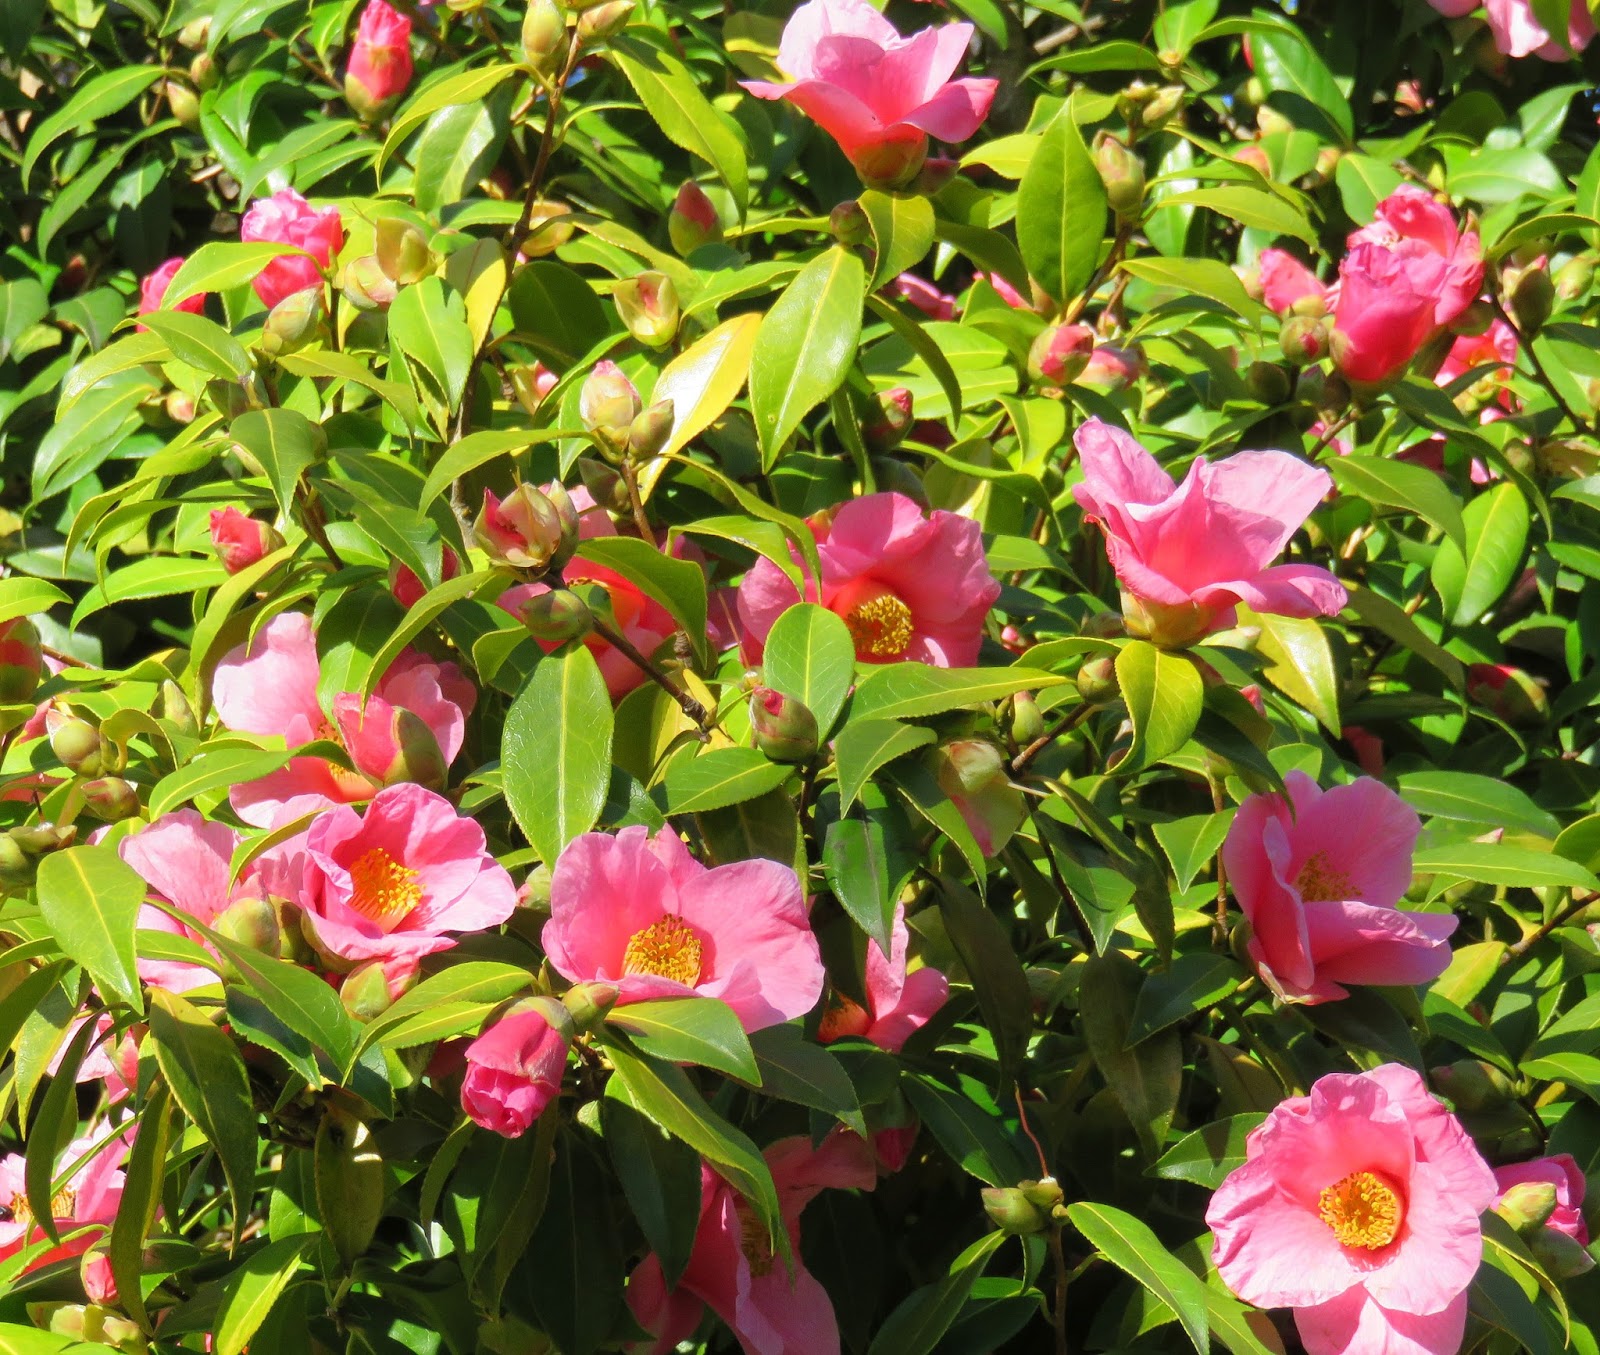
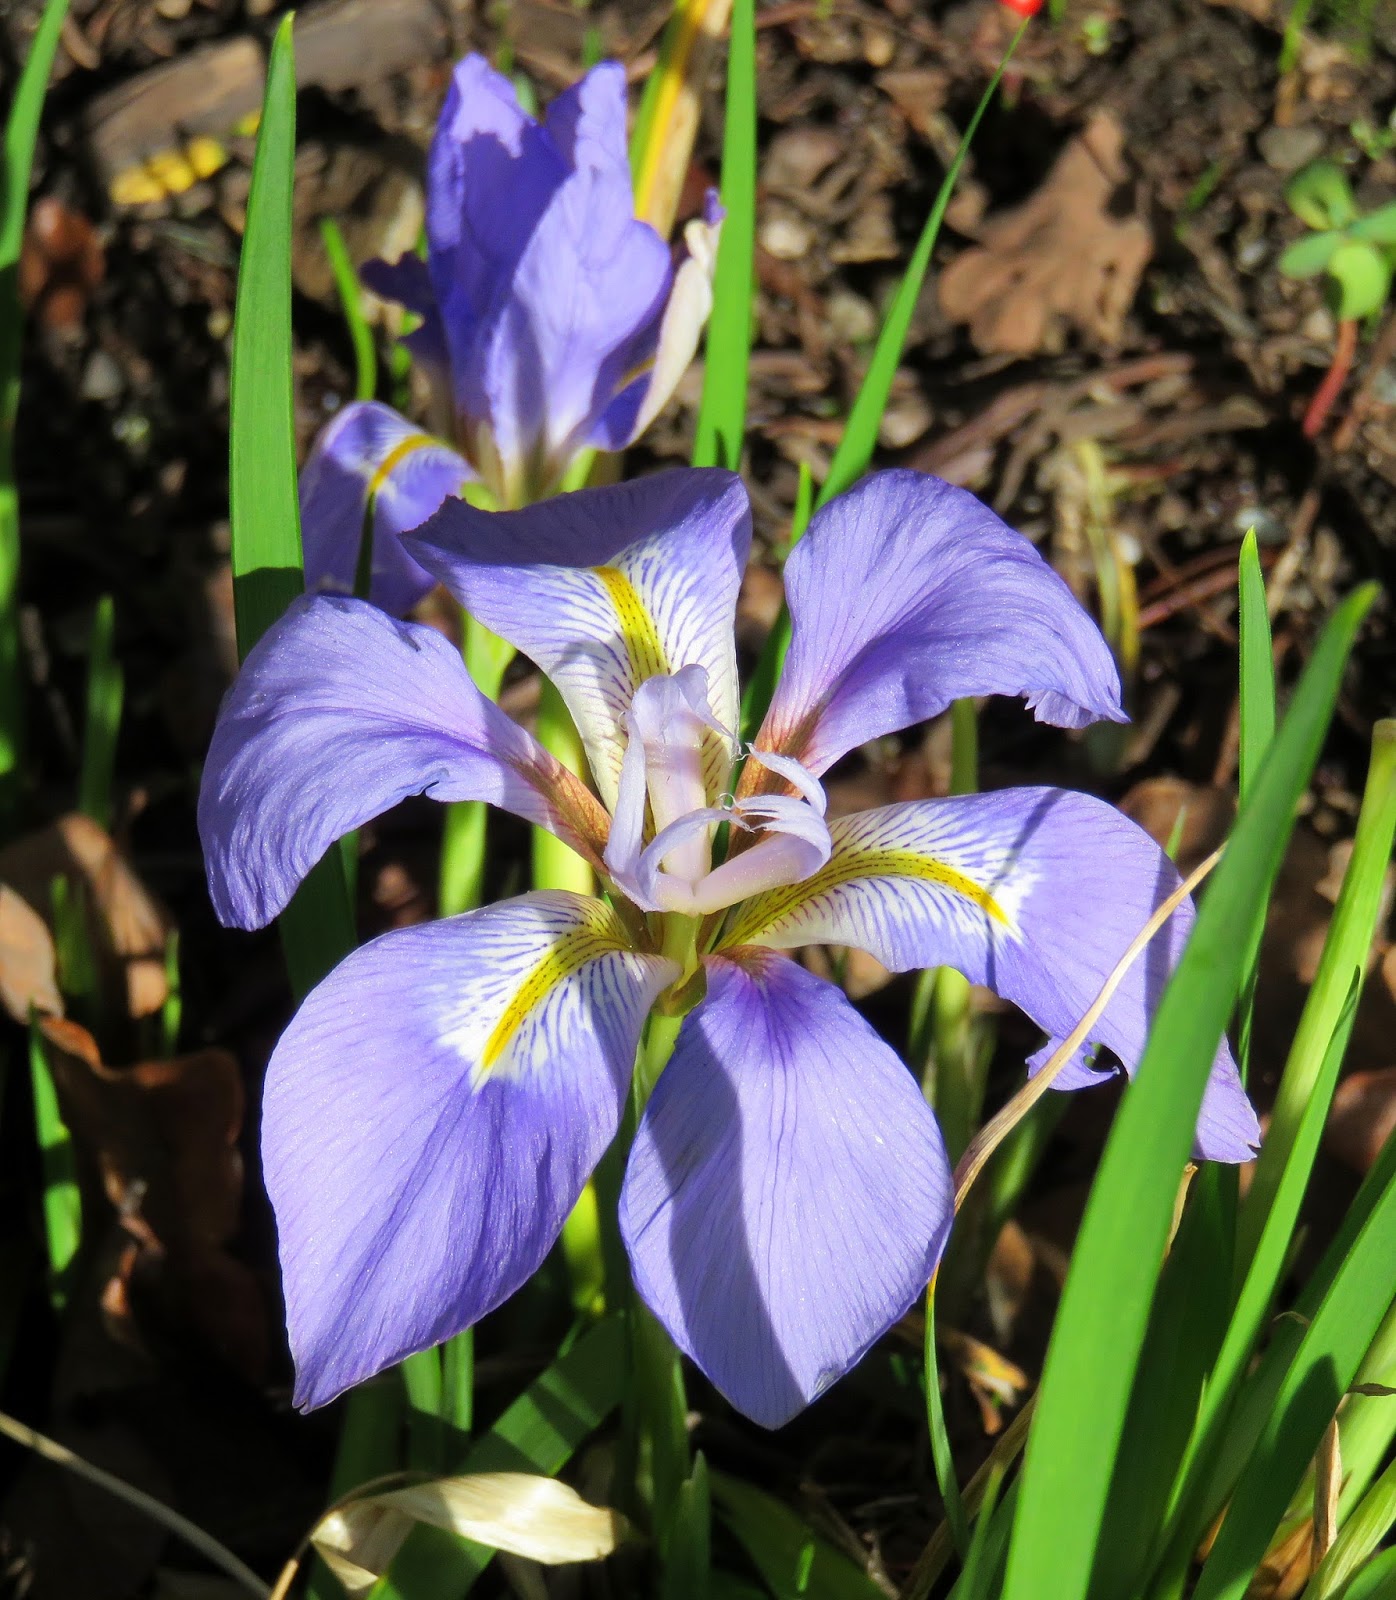
The other nice thing about February is that it's springtime!  Crocuses, daffodils, and rhodos are blooming, and the cherry blossoms are out.  Sometimes when we have mild weather in February, they will also get warm weather in Southern Alberta, with temperatures in the teens.  While that must be a nice break from the cold and the snow, it's so much nicer to enjoy the mild weather here when there is greenery and flowers everywhere!  Here's a few photos I took last week (February 8) around Victoria:

Rhododendrons at Beacon Hill Park

Camelias
Irises

Even the bees are out


Finally, here is a link to a great video that really sums up how nice February can be in Victoria.


Monday, February 1, 2016

A dry and mild January in Victoria

It’s February 1, and time for a look back at the weather for January 2016. 

The most notable feature about the weather this past January was the low total rainfall – just 47 mm compared with the 1981-2010 average of 104 mm of precipitation at Victoria Gonzales, making it the tenth driest January in 118 years of record keeping.  It may surprise you that January was so dry.  That may be because the number of days with measurable precipitation was actually slightly above average - 20 days this January versus 19 on average - but the rainfall amounts on those rainy days was significantly lower than normal.  

I’ve talked previously about the effect of the Olympic Mountain rain shadow in reducing the amount of precipitation over Victoria, and January was a prime example of that.  There were numerous days in January when there was heavy rain to the north and west, but Victoria received just a few sprinkles.  For example, the Victoria Airport – 25 km north of Victoria and outside the Olympic rain shadow – received 138 mm of precipitation in January, quite close to its normal of 143 mm.  Total precipitation amounts at the other Environment Canada weather sites in the Victoria region include 54 mm at the University of Victoria  and 75 mm at Esquimalt Harbour (which is further west and gets less rain shadowing).  

I thought it would be interesting to look in a bit more detail at the variation in rainfall around the region in January.  Victoria's School Based Weather Station Network has dozens of weather sites in the Victoria region, so I have used statistics from those sites in the chart below, which compares the January 2016 precipitation total at various sites around Greater Victoria.  You can see the impact of the rain shadow, especially in the southern and eastern sections of the region.  Some of the wetter locations in the region received nearly four times the precipitation in January than Victoria Gonzales.  


Perhaps I will try to create a map to show this at some point!

It’s also interesting to compare Victoria's January 2016 precipitation with other locations outside Greater Victoria.  As the chart shows, Pender Island (one of the drier locations on the Gulf Islands) got about 2.5 times as much rain as Victoria.  Nanaimo and Seattle both got about 4 times as much rain, while Vancouver and Courtenay received nearly 4.5 times as much rain.  Out on the exposed west coast of Vancouver Island, Ucluelet received a whopping 429 mm of rain - nearly ten times Victoria's total.  Thank you rain shadow!


There was no snowfall in Victoria during January, although some outlying areas did receive a dusting of snow.  For example, there was 3 cm of snow recorded at the Victoria Airport.  The last time Victoria received significant snowfall was January 2012.

Temperatures in January were a little above the average.  At Victoria Gonzales, the average daily high for the month was 8.1 degrees and the average daily low was 4.4, resulting in a mean monthly temperature of 6.2 degrees. That compares with the 1981-2010 average of 5.9 degrees.  The chart below compares the actual temperature trend (in green) with the average daily highs and lows for January.   The month started well below average, then gradually increased, reaching above average temperatures for most of the second half of the month.  The milder temperatures are consistent with an El Nino year, although it wasn’t as warm as during past El Nino years when the January temperature has averaged 6.8 degrees, as I discussed here.  The warmest recorded temperature during the month was 12.8 on January 22  and the coldest recorded temperature was -0.5 on January 2.  There were 3 days (the first three days of the month) with temperatures below freezing, which was close to the average of 3.4 days. 


One note on the Victoria Gonzales precipitation total.  The Environment Canada weather site at Gonzales was missing precipitation data for some days in January 2016.  Luckily, there are two Victoria School Based Weather Stations  within 500-600 m of Gonzales: Margaret Jenkins Elementary and SMU.  I used an average of these two sites to fill in the missing data for Victoria Gonzales.  

Tuesday, January 19, 2016

How often does it snow in Victoria?

It's been a while since we saw a scene like this (from 2006) in Victoria - four years, in fact!


The last time there was more than 1 cm of snow on the ground in Victoria was January 20, 2012 – four years ago tomorrow, and there’s a good chance that we will make it through the rest of this winter without snow.  Even by Victoria standards, that’s an unusually long snowless stretch.  In fact, it’s the longest snowless stretch since they began recording snow depth at Victoria Gonzales in 1955.  The second longest stretch was from February 20, 1986 to February 15, 1989 – just short of three years.   

How often does it snow in Victoria?  That’s a question that residents and non-residents frequently ask, and I have heard a lot of different answers.  Some people may think it never snows in Victoria, while others will claim it snows every winter.  I already talked about the general patterns for snow in Victoria in an earlier post, but I thought I would dig a bit more deeper into the statistics to get a better sense of just how often we actually get snow.

There are two ways of measuring snow.  The first method is to measure snowfall.  The second method is to measure the amount of snow that actually accumulates on the ground.  This can be quite different since often when it does snow in Victoria it doesn’t actually “stick” – it just melts as it hits the ground.  This would still be considered snowfall, but there would be no measured accumulation on the ground. 

Let’s first look at snowfall.  As I mentioned in my earlier post of snow, the average annual snowfall in Victoria is 20 cm.  The chart below shows average monthly snowfall in Victoria over the past 30 years (1981-2010). 


While the chart above shows average monthly snowfall, it doesn't say anything about how often Victoria actually gets snows during a given month.  The table below shows the percentage of years during 1981-2010 when there has been measurable snowfall during a given month.  The results are quite interesting.  For example, even though Victoria's "average" snowfall for December is 9 cm, the table shows that Victoria has only received measurable snowfall during 37% of Decembers between 1981 and 2010. In other words, in most Decembers it doesn't snow at all.  In fact, this is true for every month.  January is most likely to get at least some snow (47% of the time), but it still falls short of a majority of years.  In Victoria, snowfall averages tend to be skewed because most years there is little or no snow, but every several years there can be a relatively big snowfall in a given month.  

Looking at the year as a whole, 93% of winters get at least 0.2 cm of snow and (as shown in the second column) 74% of winters get at least 5 cm of snow.   


I always smile when I hear breathless reports from back east about a snowstorm that delivered “a month’s worth” of snow in a few days.  In Victoria, because big snowfalls are so infrequent, it’s quite common that when it does snow we’ll get a whole month’s worth or even a whole winter’s worth of snow in one storm.  An extreme example of this was the Blizzard of 1996, when Victoria received an amazing 107 cm of snow over 4 days in late December.  That’s the equivalent to five year’s worth of snow!  Even more impressive, we received more snow during those 4 days than we received in the following 9 winters combined!  That one snowfall in December 1996, accounted for nearly 40% of all December snowfall over a 30 year period and without it, average December snowfall in Victoria would be closer to 5 cm than 9 cm.

Instead of average snowfall, we could instead look at median snowfall.  The median is the point where half the years are above and half the years are below.  Since, as the table shows, there are no months where it has snowed the majority of years during 1981-2010, the median monthly snowfall for Victoria is 0 for every month.  While the majority of years there is no snowfall in any given month, there usually is at least some snow at some point during most winters.  The table shows that 74% of winters record at least 5 cm of snow.  The median winter snowfall is 13 cm – meaning half of winters get more than this amount and half get less.  

Now let’s look at snow on the ground.  Having snow actually accumulate on the ground is less common in Victoria than having snowfall.  Only 7% of Victoria winters during 1981-2010 recorded no measurable snowfall, but 30% of winters during the same period recorded no days with more than 1 cm of snow on the ground.  Victoria gets an average of 4.8 days (or a median of 3 days) each winter with more than 1 cm of snow on the ground.  

As mentioned at the beginning of this blog, Victoria has now experienced 3 winters in a row (2012/13, 2013/14, and 2014/15) without accumulating more than 1 cm of snow, and we're half way through our fourth snowless winter.


Thursday, January 7, 2016

So Where is El Nino?

El Nino has really started to make its presence felt in California over the past few days, with a series of storms bringing lots of rain to coastal areas - just what you would expect during an El Nino winter.  For Victoria, the conventional wisdom is that we tend to experience winters that are warmer and a bit drier than normal during El Nino years.  This year's El Nino has been touted as the largest one ever recorded, so has our winter weather lived up to the expectation so far?  Not really.

First, let's look in a little more detail at how El Nino usually impacts our winters in Victoria.  Over the past 30 winters, there have been 6 moderate or strong El Ninos: 1982-83, 1986-87, 1991-92, 1997-98, 2002-03, and 2009-10.

The table below looks at the monthly mean temperature in Victoria for December through March, comparing El Nino winters with the 30-year average.  Each month between December and March has been, on average, warmer during El Nino winters.  The difference is smaller in December and March (+0.8 degrees) but increases in January and especially February, when it peaks at a difference of +1.1 degrees.

           Mean Monthly Temperature
Dec Jan Feb Mar
1981-2010 ave. 5.3 5.9 6.5 7.9
El Nino winters 6.1 6.8 7.6 8.7
Difference 0.8 0.9 1.1 0.8

The next table compares average precipitation in Victoria during the same months.  The results are much less conclusive, with December and especially February being somewhat drier during El Nino winters, but January and March being slightly wetter.

    Average Monthly Precipitation (mm)
Dec Jan Feb Mar
81-10 ave. 95 104 61 51
El Nino 89 111 49 55
Difference -6% 7% -20% 8%

One aspect of our winters that has been significantly impacted by El Nino seems to be snowfall.  The 30-year average snowfall for Victoria is 20.1 cm.  However, for the 6 El Nino winters in the past 30 years, snowfall has averaged just 1.4 cm, or 7% of normal.  Now that's a significant difference!

So how has this winter stacked up?  December was 0.9 degrees above the 30-year average, or about what you'd expect for an El Nino winter.  However, that warmth all seemed to come in the first half of the month.  Late December, and so far in early January, temperatures have been below normal.  Precipitation in December was about 25% above normal, while so far in January it has been relatively dry.   So precipitation has been a mixed bag, but that seems to be the trend for El Nino winters in Victoria.  There has been no snow so far this winter in Victoria, so that certainly seems to follow the pattern we've seen in previous El Nino winters.  

For an El Nino that's been hyped as the biggest ever recorded, so far it seems a bit of a let down in Victoria.  The weather has been pretty chilly for about three weeks now.  One thing to keep in mind though, is that El Nino tends to have its greatest impacts in Victoria later in the winter, peaking in February.  Let's hope this monster El Nino brings us a really mild and dry February!

Monday, January 4, 2016

Monthly Review: December 2015

While, statistically, Victoria didn't experience a lot of extreme weather in December 2015, it was an interesting month.

The mean temperature for the month at Victoria Gonzales was 6.2 degrees, almost a degree warmer than the 30-year average of 5.3.  December saw an average daily high of 8.1 and an average low of 4.3, again warmer than the average high/low of 7.2 / 3.3.  However, these monthly averages mask what was almost two different months when it came to temperature.  The first half of the month was very mild - in fact the second mildest Dec 1-15 on record - with a mean temperature of 8.2 degrees and an average high/low of 10.0 / 6.3.  The second half of the month got much chillier - nearly 2 degrees below average - with a mean temperature of 4.4 and an average high/low of 6.3 / 2.5.

The warmest day of the month was 12.8 on December 8.  There were 7 days when the temperature topped 10 degrees, all between Dec. 3 and 11th.  The coldest overnight low of the month was -0.9 on December 31.  There were 2 nights when the overnight temperature dropped below freezing - December 30 and 31.  In an average December, Victoria Gonzales gets 3 nights below 0.

December was a rather wet month, with rainfall measured on 21 days, compared with the average 17.5 days for December.  Total precipitation for the  month - all rain - was 120.2 mm, 27% more than the December average of 94.8 mm.  Precipitation was also above normal at the Victoria Airport: 163.9 mm compared with the average of 142.5.  To our south, it was even wetter: Seattle had its second wettest December on record, with 285 mm and Portland had its wettest December on record with 387 mm!  The record for Victoria Gonzales is 331 mm back in December 1917.

With the continuing relatively  mild weather in December, there was no snow recorded.  The last time we saw any snow fall was more than a year ago, when 1 cm fell on November 29, 2014.  The last time we had more than 1 cm actually accumulate on the ground was January 20, 2012 - almost 4 years ago.

We experienced a lot of wind in Victoria in December, particularly during the first part of the month when there were a series of storms.  The peak wind was 104 km/hr gust on December 12.  Wind gusts topped 80 km/hr on three other days.

Friday, January 1, 2016

Year in Review: 2015

It's New Year's Day, a good time to review the weather we experienced in Victoria during 2015.


The most significant feature of the weather in 2015 was the warmth.  2015 was the warmest year on record at Victoria Gonzales, with the recording-keeping going back over 100 years to 1898.  The mean annual temperature was 11.7 degrees compared with the 1981-2010 average of 10.6 degrees.  The old record was 11.5 degrees in 2004.  Ten of the months during 2015 were warmer than normal - only September and November were below average.

Some months also broke temperature records.  February 2015 was by far the warmest February on record at Victoria Gonzales, with a mean temperature of 8.9 degrees and an average daily max/min of 11.2 / 6.6.  February was 2.4 degrees above the average of 6.5 and smashed the old record of 8.2 degrees by a wide margin.  In addition, June 2015 tied with June 2003 as the warmest on record, with a mean temperature of 16.1 degrees and an average daily max/min of 20.7 / 11.5.  Average mean temperature for June at Victoria Gonzales is 14.5.  The warmest month of the year was July, with a mean temperature of 17.6 degrees.  That makes it the third warmest July on record at Victoria Gonzales, after July 2004 (17.8) and July 1958 (17.7).  July 2015 also tied with August 1997 as the fourth warmest month on record at Victoria Gonzales.

Victoria also experienced its warmest summer on record in 2015, with a mean temperature of 16.9 degrees for June, July, and August combined compared with a normal summer temperature of 15.6 degrees.  The old record was 16.8 degrees in 2004.

The warmest temperature of the year was 31.3 degrees on July 30.  Despite 2015 being such a warm year on average, that date was the only time the temperature topped 30 degrees, compared with 5 days in 2004.  So 2015 was right on the average for Victoria Gonzales of 1 day with temperatures above 30.  We did get more than our usual number of days with temperatures above 25 degrees - 12 days compared with the average of 8.6 days.  The coldest temperature was -0.9 degrees reached on the very last day of the year - December 31.  There were just 4 days in 2015 when the overnight temperature dropped below freezing, compared with the normal 11 days.

2015 will also be remembered for the dry late spring and summer.  While summer drought is not in the least unusual in Victoria, this year was exceptional, particularly in the spring and early summer.  May 2015 was the driest on record at Victoria Gonzales, with just 1.8 mm of rain.  During the four month period from April 1 to July 31, just 24.6 mm of rain fell in Victoria compared with the usual 92.7 mm.  That makes it the driest April to July period on record in Victoria.

Despite this dry spell, above average rainfall during most of the rest of the year - especially during the last three months of the year - resulted in a wetter than average year with 735 mm compared with the average 641 mm.

Victoria recorded no snowfall during 2015.  This is the first calendar year since 1999 with absolutely  no snow.  Sometimes, Victoria will get a few snow flurries, even if it doesn't stick, but this year we didn't even get that.  With no snow falling,  Victoria continued its streak of winters with no snow accumulating on the ground.  The last time we saw at least 1 cm of snow on the ground was back in January 2012 - almost four years ago.

Victoria Gonzales Weather Summary for 2015
Month Max Min Average Rain Snow
° C ° C ° C mm cm
Jan 9.0 5.2 7.1 96.1            - 
Feb 11.2 6.6 8.9 82.8            - 
Mar 12.4 6.5 9.5 82.3            - 
Apr 13.6 6.5 10.1 10.8            - 
May 17.1 9.2 13.2 1.8            - 
Jun 20.7 11.5 16.1 3.8            - 
Jul 22.0 13.0 17.6 8.2            - 
Aug 21.1 12.6 16.9 26.5            - 
Sep 17.8 10.6 14.2 38.6            - 
Oct 15.5 10.0 12.8 108.4            - 
Nov 9.4 4.6 7.0 155.9            - 
Dec 8.1 4.3 6.2 120.2            - 
Annual 14.8 8.4 11.7 735.4            -