Showing posts with label Victoria BC. Show all posts

Saturday, September 7, 2024

Summer 2024 was wetter than normal, but close to normal temperatures

Summer 2024 in Victoria saw close to normal temperatures, but more rainfall than any summer in the past 27 years.

The mean temperature this past summer at Victoria Gonzales was 15.7 degrees, which is exactly equal to the 30-year average.  Mean temperatures were below normal in June (14.2 C vs normal 14.6 C) and August (16.1 C vs. normal 16.4 C), while July was warmer than normal (16.8 C vs. 16.2 C).  

The average daily high temperature this summer was slightly below normal 19.8 C (versus the normal of 20.0 C) while the average daily minimum was 11.5 C (right on normal).  


The chart below shows the daily maximum and minimum temperatures at Victoria Gonzales during summer 202
4, compared with the 30-year averages.  There weren't really any strong patterns: temperatures generally fluctuated between above and below normal throughout the summer.  

The warmest temperature of the summer was 28.3 C on July 10th.   The coolest temperature during the summer was 8.6 C on June 13th.


Victoria received 70.2 mm of rain from June to August, about 50% more than its normal summer rainfall of 47 mm. This was Victoria's wettest summer in 27 years.  As is typical for Victoria, most of the summer's rain fell on a small number of days: more than half (57%) fell on the 3 wettest days, and 76% fell on the 5 wettest days.  The wettest day of the summer was August 24th, with 20.2 mm (the wettest August day in 20 years).

Victoria had 14 days with measurable rainfall this summer, close to the normal 14.8 days.  There were 6 days with measurable rain (>0.2 mm) in June, 2 in July, and 6 in August.  


The chart below shows daily precipitation during summer 2024, and compares the cumulative precipitation with the 30-year average.   The first few days of June were quite rainy, then there was a long dry period until late August (including a 31-day period with no measurable rain from June 28 to July 28).  The summer ended with several more rainy days in late August.


Summer 2024 had close to normal sunshine.  June was average; July was sunnier than normal, but August was cloudier than normal  


The table below shows the number of mostly sunny days (>80% of possible sunshine), partly cloudy days (20-80% of possible sunshine), and mostly cloudy days (<20% of possible sunshine).  Summer 2024 had more mostly sunny days than normal (52 in 2024 compared with the normal of 45 days).  However, there were also more mostly cloudy days than normal (17 days compared with the normal of 12).  


Friday, March 1, 2024

After wild fluctuations, winter 2023-24 was slightly milder then normal

 Meteorological winter is from December 1 to February 29.  Winter 2023-24 was colder and drier than normal.  

The mean temperature at Victoria Gonzales this past winter was 6.5 degrees C, compared with the 30-year average of 5.8 C.  The average daily maximum temperature was 8.5 C (versus normal 7.9 C), while the average daily minimum was 4.5 C (versus the normal 3.7 C).  December was much warmer than average.  January was slightly colder than average, while February was slightly milder than average.


The chart below shows the daily maximum and minimum temperatures at Victoria Gonzales during winter 2023-24, compared with the 30-year averages.  The cold snap in mid-January really stands out, with temperatures far below normal. The temperature dropped as low as -11.5 C on January 12, the coldest temperature recorded in Victoria in 55 years (since December 1968). 

Despite the cold snap, there was also some warm weather.  December 2023 was tied with December 1939 as the warmest on record in Victoria, with a mean temperature of 7.7 C, more than 2 degrees above the 30-year average.  There was also an extraordinary mild period at the end of January, when a Pineapple Express atmospheric river brought warm subtropical air into the region.  The 5-day period from January 28 to February 1 was the mildest 5-day period ever recorded during the winter in Victoria.  The mean temperature was 11.8 C, and highs exceeded 15 C on January 29 & 30.  There were also 3 days with overnight lows above 10 C - by far the earliest that has ever occurred in Victoria.  The previous earliest occurrence was March 12. 


Winter 2023-24 saw very close to normal precipitation.

The chart below shows daily precipitation during winter 2023-24, and compares the cumulative precipitation with the 30-year average.  Precipitation tracked close to average throughout the winter.  December and February were both slightly drier than normal, while January was slightly wetter than normal.  The wettest day of the winter was December 4th, when 19.4 mm fell.  

While precipitation was average, the number of days with measurable precipitation was above average: 51 days during winter 2023-24 vs. the 30-year average of 46.3 days.


Winter 2023-24 saw less snow than normal.  There was 8.5 cm of snow compared with the normal 14 cm.  All of the snow was recorded in January.  There were 3 days with at least 2 cm of snow on the ground - close to the 30-year average of 3.2 days for the winter.

Sunday, August 14, 2016

Victoria's advantage when the weather is unsettled

We're currently into a perfect stretch of warm, dry and sunny summer weather: take a look at the forecast for Victoria for the next week.


However, it seems like earlier in the summer the weather was a bit more unsettled than usual, especially in June and the first half of July.  While we might complain when the weather's not perfect in the summer, we should remember that compared with other locations in the region, Victoria's weather actually stands out the most when the weather pattern is a bit more unsettled.  When we have a strong ridge of high pressure giving us the sunny weather we're currently experiencing, other parts of the B.C. south coast are usually experiencing similar conditions.  It's when the weather's unsettled that Victoria's climate really shines.  Unsettled weather during the summer might mean a little more cloud and a chance of sprinkles in Victoria, while in other parts of the region they are getting much more cloud and rain.

Let's start by comparing the rainfall in Victoria and Vancouver this summer.  The chart below compares monthly rainfall from May up until today (August 14) at Victoria Gonzales and Vancouver Harbour (downtown).  You can see that Vancouver has clearly had a LOT more rain.

Summer 2016 Monthly Rainfall, Victoria vs. Vancouver

On average, Vancouver gets about three times as much rainfall from May to August than Victoria (240 mm vs. 80 mm).  This year, Vancouver has had five times as much rain as Victoria (224 mm vs 45 mm).

The chart below compares the total May-August 2016 rainfall (up to August 14) at Victoria Gonzales with several other  locations in the region.  Although the Victoria Airport usually gets about 35-40% more rain than Victoria Gonzales during the summer, this year it's been almost as dry.  However, Vancouver Airport (located in a relatively dry part of the Vancouver region) has had more than three times as much rain as Victoria, and as we've seen, Vancouver Harbour has seen five times as much rain.  Nanaimo, Comox, and Campbell River - which normally get about twice as much rain as Victoria during the summer - have received nearly three times as much rain as Victoria this summer. Finally, Seattle Airport - which normally gets about 60% more rain than Victoria during the summer - has received about double Victoria's rainfall this summer.

Total Rainfall, May to August 2016

So during this somewhat unsettled summer, other locations in the region have received even more rain relative to Victoria than they normally do.  We might grumble sometimes when we get a patch of unsettled weather in the summer instead of the endless sunny days that we expect, but we should keep in mind that when it's unsettled here in Victoria, it's probably still a lot better weather than other parts of the region.

While we're talking about the rainfall amounts this summer, I'd just like to comment on another case of it all being relative.  We've heard in the news that Southern Ontario is experiencing a severe drought this summer.  In Toronto, they have received just 45% of their normal rainfall since the beginning of May.  Sounds pretty dry, doesn't it?  The thing is, normal May-August rainfall in Toronto is 300 mm, so 45% of that is 135 mm - or about three times as much rain as Victoria has seen over the same period.  For Victoria, 135 mm of rain during May to August would be an unusually wet summer, and certainly wouldn't be considered a severe drought!  In fact, in 117 years of record-keeping at Victoria Gonzales, there have only been five summers where our rainfall totals have reached 135 mm.  As I said, it's all relative!

Tuesday, June 14, 2016

May was another warm month

After a record warm April in Victoria, our warm streak continued in May.  The mean temperature of 14.1 degrees was just shy of the record (14.2), set back in 2005.  The 30-year normal temperature for May at Victoria Gonzales is 12.3 degrees.  The average daily high/low temperatures this May were 18.3/9.9 compared with the normal of 16.2/8.4.  May was even warmer at the Victoria Airport, with a mean temperature of 14.4 degrees.  This made May 2016 the warmest on record at the Airport, following the warmest April on record.  It's pretty rare to get back-to-back monthly temperature records!  The average daily high/low temperatures at the Airport were 19.7/9.1 - more like June than May.

The chart below compares the daily high and low temperatures this May at Victoria Gonzales compared with the 30-year average.  You can see that temperatures were well above average during the first half of the month.  Temperatures were closer to average in the second half of the month, although there was a spike on May 31.

Daily High & Low Temperatures at Victoria Gonzales, May 2016

May was also dry, with just 10.4 mm of rain in Victoria, compared with the normal of 28.6 mm.  By comparison, there was 12.8 mm of rain at the Victoria Airport, 51.6 mm at the Vancouver Airport, and 76.6 mm at Vancouver Harbour.

The chart below shows daily and cumulative rainfall (red line) compared with the average cumulative rainfall (blue line) at Victoria Gonzales for May 2016.  Clearly, it was much drier than average.  Nearly three quarters of the month's rainfall fell on one day - May 28.

Daily and Cumulative Rainfall at Victoria Gonzales, May 2016

With the mild temperatures in March, followed by record or near record temperatures in April and May, Spring 2016 was the warmest on record at both Victoria Gonzales and at the Airport.  At Gonzales the mean temperature was 11.9 degrees compared with the average of 10.1.  Average high/low temperatures at Victoria Gonzales were 15.4/8.3 compared with the normal spring high/low of   13.5/6.5.

How long will this string of warmer than average temperatures last?  Perhaps not much longer since El Nino is now dead and there is a La Nina on the horizon.

Sunday, May 1, 2016

A record-breaking April

Our streak of warmer than average months continued in a big way in April - it was the warmest April on record in Victoria.  The mean temperature at Victoria Gonzales was 12.4 degrees, easily beating the old record of 12.1 degrees set back in April 2004, and well above the 30-year average of 9.9 degrees.  The temperatures this April were more like May - in fact the mean temperature equaled the 30-year average for May.  The average daily maximum and minimum temperatures were 15.9/8.8 vs. the April normal 13.4/6.3.   The warmest temperature was 25.5 degrees on April 20 (close to the all time April maximum of 27.0).  The coolest temperature was 7.1 degrees on April 9.  That is the warmest extreme monthly minimum ever recorded for April.

The chart below compares the daily maximum and minimum temperatures for April with the 30-year average temperatures.  Maximum temperatures cycled between being close to average and being well above average.  The overnight minimum temperatures were consistently above average.

Daily maximum and minimum temperatures, April 2016
The warmth wasn't limited to Victoria Gonzales.  April 2016 was also the warmest on record at the Victoria Airport, as well as in Vancouver, Seattle, and Portland.

April was also much drier than normal, with just 8.8 mm of rain at Victoria Gonzales, compared with the 30-year average of 31.5 mm.  There was measurable rainfall on 7 days in April compared with the normal of 11 days.

The chart below shows the daily and cumulative rainfall at Victoria Gonzales for April 2016.  Clearly, it was much drier than normal.

Daily and cumulative precipitation, April 2016
It was generally dry throughout the region in April, although, as is typical, other areas did get more rain than Victoria.  The chart below compares April rainfall totals.  Compared with 8.8 mm at Victoria Gonzales, amounts at the Victoria Airport were quite similar (10.4 mm).  Somewhat higher amounts were recorded at Saltspring Island (24.1 mm), Vancouver Harbour (26.3 mm) and Seattle Airport (30.2 mm).


Tuesday, April 19, 2016

The Mild Streak Continues in March

I'm a little late, but I'm finally getting around to looking back at last month's weather!

The mild streak continued in March, with a mean temperature of 9.1 degrees, compared with a 30-year March average of 7.8.  That's warm enough to make it into the top 10 warmest Marches in the past 118 years at Victoria Gonzales.  The average daily maximum and minimum this March were 11.9 and 6.2, compared with the  normal 11.0 and 4.8.  The warmest temperature was 18.0 on the 30th and the coolest was 3.2 on the 16th.

The chart below compares the daily maximum and minimum temperatures this month with the 30-year averages.  You can see that temperatures were generally above average, particularly at the end of the month.  The daily minimum temperature was above average for 23 of 31 days in March.

March 2016 Temperatures in Victoria

March 2016 was quite close to average in terms of precipitation, with 56 mm compared with the average of 50 mm.  The chart below compares the daily and cumulative precipitation for the month with the average cumulative precipitation.  You can see that the month started out quite wet, and by mid-month we were were at almost double our normal precipitation.  However, the second half of the month was dry so were were only slightly above normal by the end of the month.  There was measurable precipitation on 16 days, slightly more than the normal of 15 days.  The wettest day was the 9th, with 15 mm of rain.

March 2016 Daily Precipitation

The chart below compares Victoria's total precipitation in March 2016 with some nearby locations.  As is typical, Victoria was a lot drier.  Compared with Victoria (as measured at the Gonzales weather site),  the Victoria Airport had just over double the rainfall - 119 mm vs 56 mm.  Nanaimo was particularly wet this March, with 247 mm - more than four times as much rain as Victoria. Vancouver, with 198 mm had almost four times as much rain while Seattle, with 140 mm, had about 2.5 times as much rain as Victoria.


March was also another month with no snow in Victoria, which also means another winter with no snow.  We have now had four winters in a row with no snow.  The last time Victoria saw snow accumulate on the ground (more than 1 cm) was January 2012.

Thursday, March 3, 2016

A Look at Winter 2015/16

The end of February is also the end of meteorological winter (December to February).  So what was winter like in Victoria?

First, it was mild.  The mean temperature over the three month period was 6.8 degrees - a full degree above the 30-year average of 5.8 degrees.  Winter 2015/16 tied for the 7th warmest winter on record in Victoria (with 118 years of record-keeping), although it was still well below the all time record of 7.6 degrees which we hit last winter.  The average daily max/min temperature this past winter was 8.9/4.8.  The warmest temperature was 14.0 on February 9th and the coldest was -0.9 on December 31st.  There were 5 days when the temperature dropped below 0, which all occurred between December 30th and January 2nd.  The 30-year average for Victoria Gonzales is 7.6 days with overnight temperatures dropping below freezing during the winter.

The chart below shows the daily maximum and minimum temperatures this winter, compared with the 30-year averages.  You can see that, except for the last 10 days of December and the first 10 days of January, temperatures were pretty consistently above average.  This is an El Nino year, so the mild temperatures are to be expected.  In fact, the mean temperature this winter of 6.8 degrees was the same as the average for the past 6 moderate or strong El Nino winters, as discussed here.

Daily max & min temperatures, winter 2015/16
This winter was also a little wetter than normal, but not by much.  Total precipitation from December to February was 280 mm, compared with the 30-year average of 259 mm.  The chart below shows the daily and cumulative precipitation this winter compared with the average.  You can see that precipitation ran a little ahead of normal in December.  This was followed by a dry January, with just 47 mm of rain.  Most of February was quite dry as well, but the heavy one day rainfall we received on the 15th pushed us above normal for the season.


Victoria's 280 mm of precipitation this winter compared with 681 mm in Vancouver and 626 mm in Seattle (where it has been the wettest winter rainy season on record).

There was no snow this winter, and it continues a snow drought for Victoria.  We had a couple of light dustings of snow during the winter of 2013/14, but you have to go back to the winter of 2011/12 for the last time we had significant snowfall (more than 3 cm).  That's four winters in a row now with little or no snow.

Tuesday, March 1, 2016

A mild February that was both wet and dry

It was a mild February in Victoria, with a mean temperature of 8.0 degrees, compared with the 30-year February average temperature of 6.5 degrees.  That makes it the 4th warmest February on record at Victoria Gonzales (with 118 years of record-keeping), behind 2015 (which was a record-shattering 8.9 degrees), 1998 (8.2 degrees), and 1963 (8.1 degrees).  The average daily maximum and minimum temperatures this February were 10.4 and 5.6 degrees.  The warmest temperature was 14 degrees on February 9 and the coolest was 3 degrees on February 1.  There were 15 days when the temperature topped 10 degrees, compared with the average of 8.9 days.  Last February, the temperature topped 10 degrees on 21 days.

The above normal temperatures in February continued the trend of the past couple of years.  Since the beginning of 2014, 23 of the past 26 months have been warmer than the 30-year average.

The chart below compares the daily maximum and minimum temperatures in February 2016 with the 30-year averages for those dates.  Clearly, most of the month experienced above average temperatures, except for a short period around February 20-21.

Daily Maximum & Minimum Temperatures, February 2016

February 2016 was undoubtedly wet: total rainfall was 112 mm, nearly  double the average February precipitation of 61 mm, and there were 22 days with measurable rain compared with the average 13 days.  However, more than half of February’s rainfall fell on just one day, the 15th.  As I discussed here, the rainfall that day was exceptional, the most at Victoria Gonzales in one day since 2006.  If you remove that day, rainfall during the rest of the month was actually a bit below average, although the number of days with rainfall was still higher than normal.  The chart below shows the daily and cumulative rainfall in February compare with the 30-year average.  You can see the impact of the February 15th deluge. 

Daily & Cumulative Rainfall, February 2016

While Victoria was much drier than surrounding areas in January, the difference was not quite so great in February (again thanks to all that rain on the 15th).   The table below compares February 2016 rainfall in several locations around the region.  Rainfall at Victoria Gonzales was very similar to Victoria Airport in February 2016 – whereas normally the Airport gets 46% more precipitation in February.  Victoria still got less rain than Nanaimo, Vancouver, or Seattle, but the difference wasn’t as great as usual. 


There was no snow during February 2016, and none since the 1 cm dusting we received in November 2014.  We haven't had significant snow on the ground since January 2012.  Normal snowfall for February is 3.6 cm, although Victoria has received measurable snowfall in February only a little over one third of the time over the last 30 years.

Tuesday, February 16, 2016

A very rainy day in Victoria!

Up until Sunday, it had been a dry start to the year, with just 81 mm since January 1, compared with our normal of 134 mm in the first 45 days of the year.  Then came yesterday (February 15) - what a very rainy day!  There was 61.6 mm of rain recorded at Victoria Gonzales.    Average rainfall for the entire month of February is 61 mm, so that's a month's worth of rain in one day.  It was also far more than the 47 mm of rain we had in the entire month of January 2016, even though we had 20 days with measurable precipitation during that month.  Yesterday's rainfall was quite rare for Victoria.  It certainly blew away the old record for the date of 28.2 mm of rain back in 1949.  It was the most rain recorded at Victoria Gonzales in a single day since since November 6, 2006 - more than 9 years ago.  It was also the second rainiest February day ever recorded at Victoria Gonzales in more than 117 years of recording-keeping, and the 17th rainiest day ever recorded in any month!  On average, Victoria gets a day like yesterday with more than 60 mm of rain only once ever 7 years.

As the chart below shows, yesterday's rain completely closed the rain deficit we'd had so far this year.  The blue line shows the 30-year average rainfall to date while the red line shows the cumulative total rainfall for 2016.  You can see that we've been well below average so far this year, but with yesterday's deluge, we have jumped to just above average.  The green bars show the daily rainfall amounts, and you can see how much rainier yesterday was compared with any other day this year.


Why did we get so much rain?  There were two factors.  The first was an atmospheric river or "pineapple express" carrying subtropical moisture directly to our area.  Usually during a pineapple express, as the moisture streams in from the southwest, Victoria is protected by the rain shadow of the Olympic Mountains, and our rainfall totals are a lot less than areas to the north and west of us.  However, this pineapple express, rather than coming from the southwest, was coming from a more westerly direction.  When that happens, the rain shadow shifts from being northeast of the Olympics (and usually including Victoria) to be more east of the Olympics (giving more protection to Seattle).  Westerly flows are often when Victoria will get it's heaviest rainfall.   When I saw in the forecast on Sunday that there was going to be an atmospheric river coming at us from the west, I expected we'd get more than our usual light showers!

Below is an interesting radar image from about noon yesterday.  Instead of being in the hole of the donut, as we often are, Victoria is right in the bulls eye!


Saturday, February 13, 2016

February blahs? Not in Victoria!

You often hear the term February blahs, especially from people in other parts of Canada who are tired of the cold, snow and slush, and they know that they probably have a couple more months of winter to endure.  I think this is the time of year when I am most appreciative of living in Victoria.  This may not be the nicest time of year in Victoria, but compared with most of the rest of Canada, it is heaven.  (It was -26 degrees in Toronto this morning, although granted that is very cold even for them!)


versus


As I mentioned in this post, while February is still the depth of winter in many parts of Canada, the coldest and dreariest point of the winter in Victoria tends to happen quite early, around the end of December.  By February, the weather is noticeably warmer, drier, and sunnier.  The average high temperature in February in Victoria is 9 degrees, a degree warmer than January and nearly two degrees warmer than December.

February is also noticeably drier, with an average of just 61 mm of precipitation compared with more than 100 mm each month in November, December, and January - the end of the rainy season is definitely in sight!  On average, there is a 43% chance of measurable precipitation on any given day in February (compared with than 50% in November, December, and January).  As I've said before, I think looking at the % chance of rain on any given day somewhat overstates how rainy it is, since a day with measurable precipitation doesn't necessarily mean rain all day - it could be a brief shower.  Another way to look at at this is the % of hours with measurable precipitation, and for Victoria in February there is precipitation just 19% of the time.

The sun is also making more of an appearance, with 98 hours of sunshine in a typical February in Victoria.  That works out to an average of 3.5 hours per day, compared with only 2.3 hours per day in January and 2.0 hours per day in December.  On average, February gets 22 days with at least some measurable sunshine, and overall, it is sunny about 35% of the time (at least during daylight hours!).  In other words, during daylight hours it's actually more likely for the sun to be shining February (35% of the time) than it is to be raining (19% of the time).

Snow is also pretty rare in February in Victoria.  Over the past 30 years, only 11 Februarys have seen any snow at all and just 5 of the past 30 Februarys saw significant snowfall (more than 10 cm).  When it does snow, it melts quickly; Victoria averages just 0.7 days with snow on the ground during February.

The other nice thing about February is that it's springtime!  Crocuses, daffodils, and rhodos are blooming, and the cherry blossoms are out.  Sometimes when we have mild weather in February, they will also get warm weather in Southern Alberta, with temperatures in the teens.  While that must be a nice break from the cold and the snow, it's so much nicer to enjoy the mild weather here when there is greenery and flowers everywhere!  Here's a few photos I took last week (February 8) around Victoria:

Rhododendrons at Beacon Hill Park

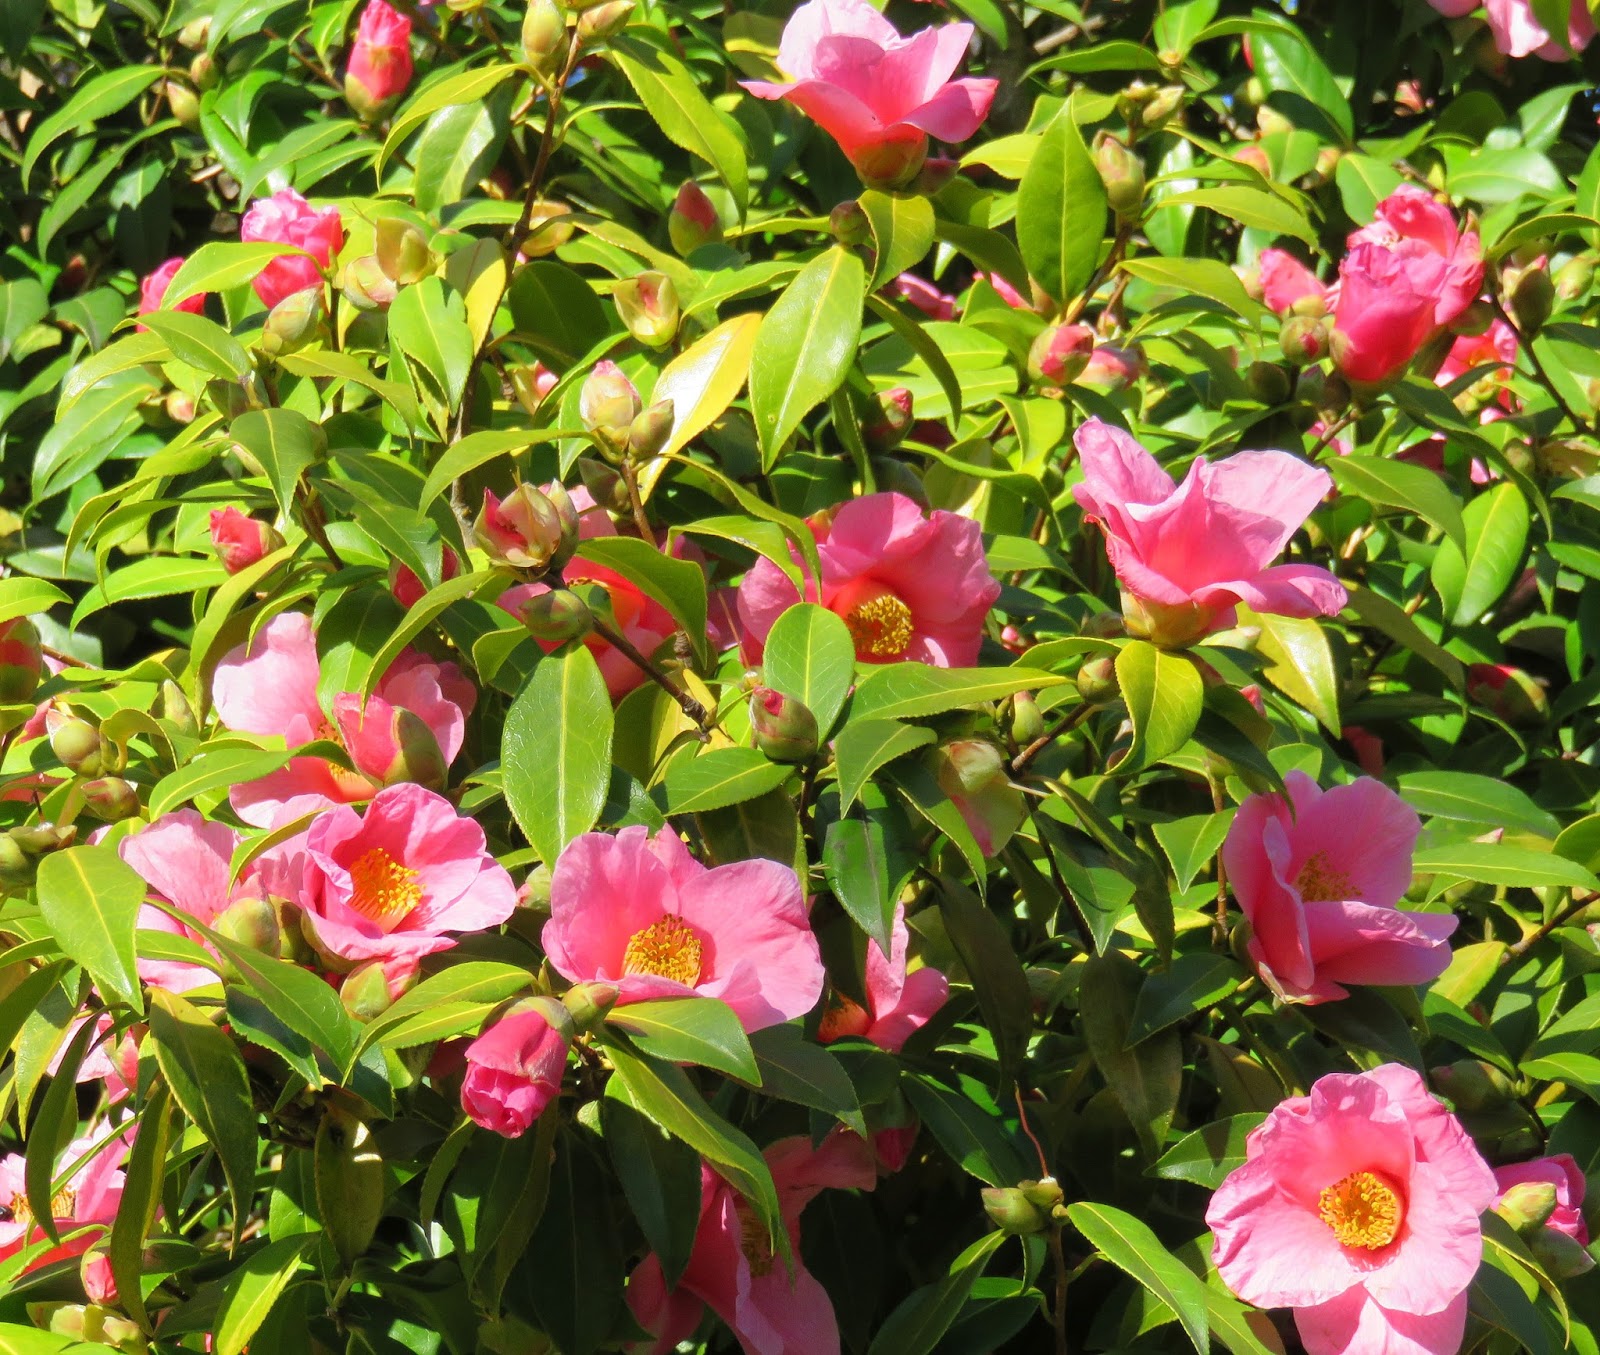
Camelias
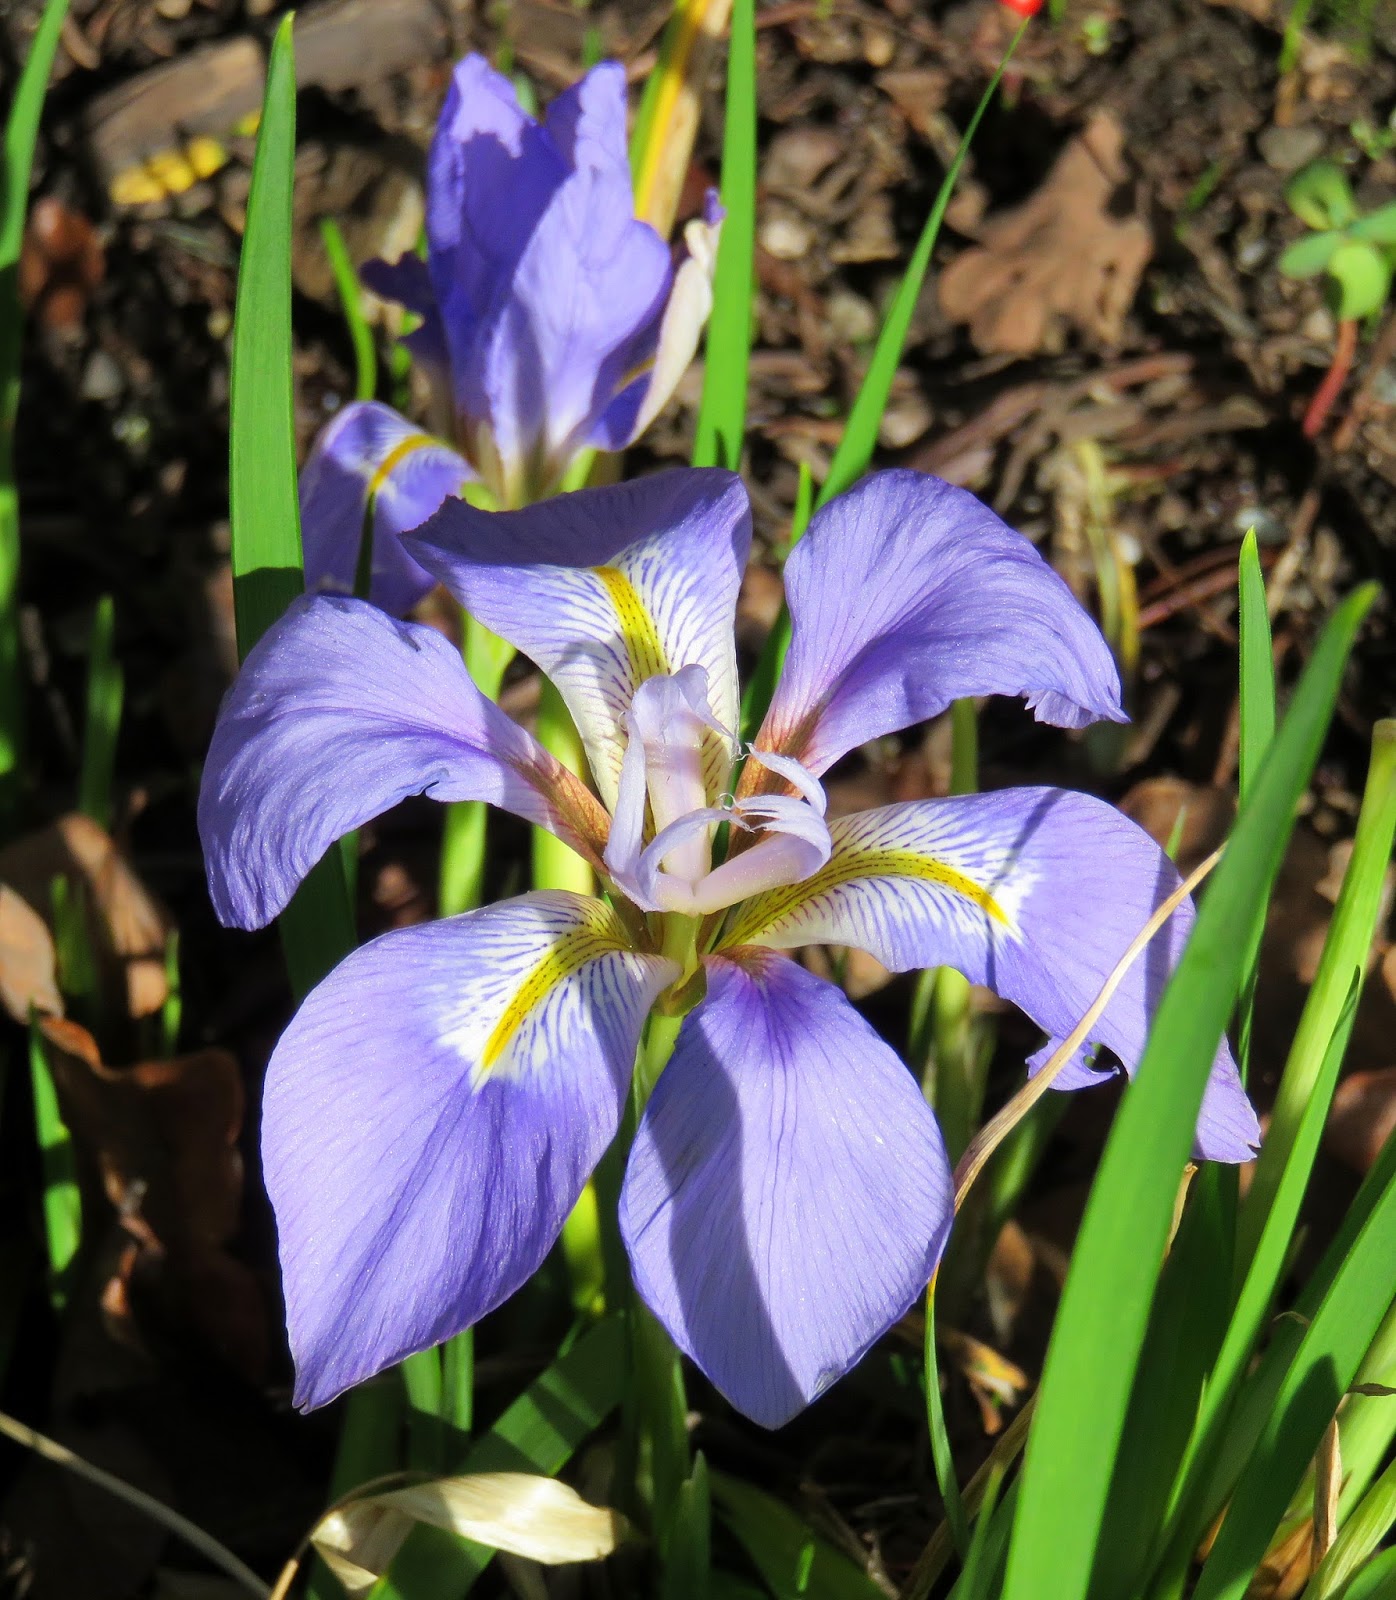
Irises

Even the bees are out


Finally, here is a link to a great video that really sums up how nice February can be in Victoria.


Saturday, February 6, 2016

Climate change on the B.C. coast: What is the long term temperature trend in Victoria?

We've talked a lot about the current climate in Victoria, mostly using the most recent 30-year average (1981-2010).  Today, I'd like to look at the longer term picture.  How has the climate changed over time?  Luckily, in Victoria we are very well placed to look at long term trends thanks to the very long period of record at the Victoria Gonzales weather site.  It's  been gathering weather data since 1898 - nearly 118 years - making it the longest such record in B.C. and one of the longest on the west coast of North America.

Let's start by looking at the trend in mean annual temperature - the average of all high and low temperatures for the entire year.  In the chart below, the solid red  line shows the annual mean temperature for each year from 1899 to 2015, while the dashed blue line is the mean temperature for the entire period - 10.2 degrees.  The mean temperature has ranged from 8.6 degrees in 1916, the coolest year, to 11.7 degrees in 2015, the warmest year.  Clearly, there is a lot of variability from year to year, which makes it difficult to see the longer term trends.


To make it a little easier to see the longer term changes, the next chart uses a rolling ten-year average.  The first point on this chart is the average for 1899-1900, the next point is 1900-1910, and so on.  This smooths out the yearly fluctuations and you can start to see the trends.  One thing you'll notice is that the temperature appears to have fluctuated between warmer and cooler periods.  For example, it was generally much cooler than average in the 1910s and early 1920s.  This was followed by a warmer than average period in the 1930s and 1940s.  There was generally a cooler period again in the 1960s and 1970s, but then it became much warmer once again in the 1990s and 2000s.  One thing to note is that the cooler period in the 1960s and 1970s wasn't as cool as the earlier cool period, while the warmer period in recent decades has been warmer than the last warm period in the 1930s and 1940s.  So underlying these decadal fluctuations, there does seem to be an overall longer term warming trend.


This pattern is likely caused at least in part by the Pacific Decadal Oscillation (PDO).  This is a long term fluctuation in the temperature of the North Pacific Ocean which also leads to atmospheric changes that affect our weather.  In some ways, it is similar to El Nino, but whereas the cycle between El Ninos is usually a few years, the PDO cycle is more like 20-30 years.  Over the past century, the PDO was in a cool phase until about 1925, then a warm phase during 1925-47, followed by a cool phase during 1947-77, and then a warm phase during 1977-2007.  The chart below shows the PDO Index over this period.  You can see that it matches quite closely with the longer term temperature swings we've observed in Victoria.


In order to see the long range trend more clearly, the chart below uses a rolling 30-year average temperature.  The first point on this chart is the 1899-1929 average, the second point is the 1900-1930 average, etc. with the last point being 1985-2015.  Just as the 10-year rolling average smoothed out the year to year fluctuations, the 30-year rolling average smooths out some of the decadal fluctuations.  Now you can see that there has indeed been a long term warming trend, particularly over the past 40 years.  During this time, the 30-year average temperature has increased from 9.9 degrees for 1947-77 to 10.7 degrees for 1985-2015, so roughly a 0.8 degree warming.  That may not be as much warming as some other locations have experienced - the B.C. coast and the U.S. Pacific Northwest have generally seen less warming from global warming than other regions - but a 0.8 degree increase in a 30-year average temperature is very significant.


Interestingly, the amount of warming has varied quite significantly depending on which month you look at.  For example, there has been virtually no change in 30-year average temperatures during both September and December.  By contrast, Januarys have become much warmer, rising from a 1949-79 mean of 3.8 degrees to a 1985-2015 mean of 5.7.  That 1.9 degree rise over the past 40 years is more than double the increase in the annual temperature.  As a result, January has gone from being the coldest month of the year in Victoria to the second coldest, after December.

Another way to examine the warming trend is to look at extreme temperatures.  For example, Victoria recorded low temperatures  below -10 degrees in 19 winters during the period between 1898 and 1990 - about once every 5 winters.  However, the last time Victoria had a temperature below -10 was December 1990, meaning we have now experienced 25 winters in a row without getting down that cold.  Even temperatures below freezing are becoming much less common.  For the 1949-79 period, there was an average of 19 days each year with overnight lows below 0.  For the most recent 30-year period, that has dropped to an average of just 10 days each winter.

We can also look at the trend in annual snowfall as a surrogate for temperature.  The chart below shows the trend in 30-year average seasonal snowfall in Victoria.  You can see that it peaked in the 1950s and 1960s during the cold phase of the POD, but has declined significantly since then, dropping from more than 35 cm annually down to around 20 cm annually for the most recent 30-year period.


Wednesday, February 3, 2016

Another Rain Shadow

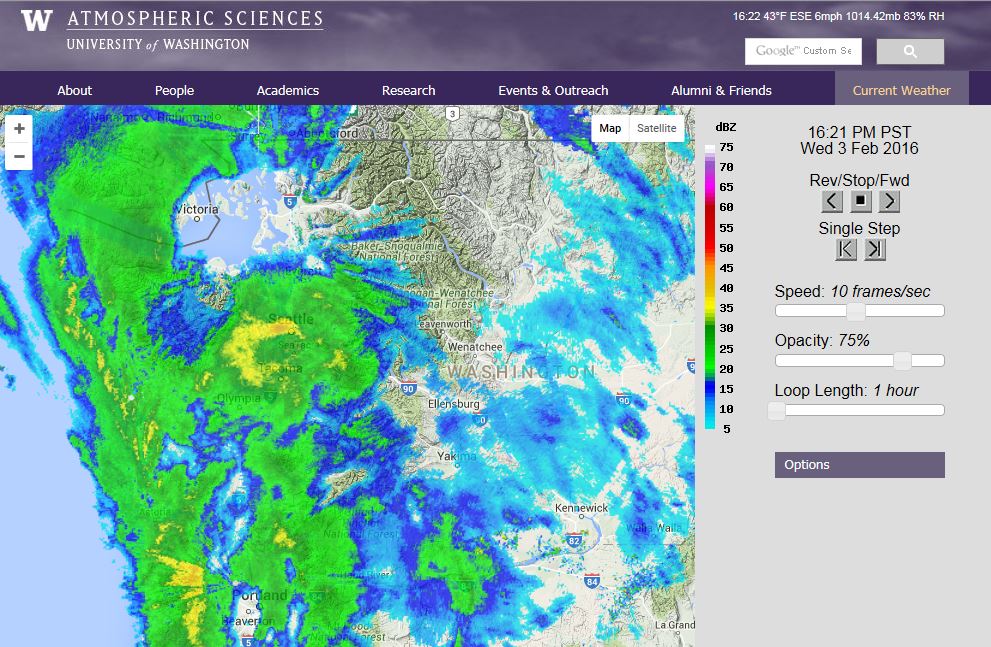
Continuing our pattern from January, we had another good rain shadow today.  Here's the radar from about 4:30 this afternoon:


The rain shadow seems quite strong.  Sometimes only the very southeastern part of Victoria is in the rain shadow, but this one is extending out west towards Sooke and north towards Sidney.

A look at the daily rainfall totals as of 6 pm:

0 mm at most sites in Victoria, Esquimalt, Oak Bay and Saanich
0.5 mm in Sidney
6 mm in Sooke
8 mm in Duncan
16 mm in  Ladysmith
18-20 mm at most sites in Nanaimo

But as a write this, I can hear a few drops of rain starting to fall.  Here's the latest radar, from just before 6 pm:


It looks like the rain may starting to move in.  It was nice while it lasted!

Monday, February 1, 2016

A dry and mild January in Victoria

It’s February 1, and time for a look back at the weather for January 2016. 

The most notable feature about the weather this past January was the low total rainfall – just 47 mm compared with the 1981-2010 average of 104 mm of precipitation at Victoria Gonzales, making it the tenth driest January in 118 years of record keeping.  It may surprise you that January was so dry.  That may be because the number of days with measurable precipitation was actually slightly above average - 20 days this January versus 19 on average - but the rainfall amounts on those rainy days was significantly lower than normal.  

I’ve talked previously about the effect of the Olympic Mountain rain shadow in reducing the amount of precipitation over Victoria, and January was a prime example of that.  There were numerous days in January when there was heavy rain to the north and west, but Victoria received just a few sprinkles.  For example, the Victoria Airport – 25 km north of Victoria and outside the Olympic rain shadow – received 138 mm of precipitation in January, quite close to its normal of 143 mm.  Total precipitation amounts at the other Environment Canada weather sites in the Victoria region include 54 mm at the University of Victoria  and 75 mm at Esquimalt Harbour (which is further west and gets less rain shadowing).  

I thought it would be interesting to look in a bit more detail at the variation in rainfall around the region in January.  Victoria's School Based Weather Station Network has dozens of weather sites in the Victoria region, so I have used statistics from those sites in the chart below, which compares the January 2016 precipitation total at various sites around Greater Victoria.  You can see the impact of the rain shadow, especially in the southern and eastern sections of the region.  Some of the wetter locations in the region received nearly four times the precipitation in January than Victoria Gonzales.  


Perhaps I will try to create a map to show this at some point!

It’s also interesting to compare Victoria's January 2016 precipitation with other locations outside Greater Victoria.  As the chart shows, Pender Island (one of the drier locations on the Gulf Islands) got about 2.5 times as much rain as Victoria.  Nanaimo and Seattle both got about 4 times as much rain, while Vancouver and Courtenay received nearly 4.5 times as much rain.  Out on the exposed west coast of Vancouver Island, Ucluelet received a whopping 429 mm of rain - nearly ten times Victoria's total.  Thank you rain shadow!


There was no snowfall in Victoria during January, although some outlying areas did receive a dusting of snow.  For example, there was 3 cm of snow recorded at the Victoria Airport.  The last time Victoria received significant snowfall was January 2012.

Temperatures in January were a little above the average.  At Victoria Gonzales, the average daily high for the month was 8.1 degrees and the average daily low was 4.4, resulting in a mean monthly temperature of 6.2 degrees. That compares with the 1981-2010 average of 5.9 degrees.  The chart below compares the actual temperature trend (in green) with the average daily highs and lows for January.   The month started well below average, then gradually increased, reaching above average temperatures for most of the second half of the month.  The milder temperatures are consistent with an El Nino year, although it wasn’t as warm as during past El Nino years when the January temperature has averaged 6.8 degrees, as I discussed here.  The warmest recorded temperature during the month was 12.8 on January 22  and the coldest recorded temperature was -0.5 on January 2.  There were 3 days (the first three days of the month) with temperatures below freezing, which was close to the average of 3.4 days. 


One note on the Victoria Gonzales precipitation total.  The Environment Canada weather site at Gonzales was missing precipitation data for some days in January 2016.  Luckily, there are two Victoria School Based Weather Stations  within 500-600 m of Gonzales: Margaret Jenkins Elementary and SMU.  I used an average of these two sites to fill in the missing data for Victoria Gonzales.  

Sunday, January 31, 2016

When the weather doesn't change: rainy streaks, dry streaks, cloudy streaks and sunny streaks

You've probably heard people say something like this:  "We have a saying around here.  If you don't like the weather, wait a minute."  Almost everywhere I've visited, I've heard some variant of this expression.  It always struck me as funny, because it implies some kind of unique changeability in the local weather, and yet people everywhere seem to say this!

I've certainly heard people say this about Victoria, but if anything, I think that what's more unique about Victoria's weather, at least compared with other places in Canada, is not its changeability - lots of places have changeable weather - but its stability.  For one thing, the temperatures tend not to fluctuate as much as they do in other parts of Canada.  In addition, we often get long stretches of similar weather, which can be both good and bad.  In the summer, we get long stretches of sunny, dry weather, but in the late fall and winter we often get long stretches of cloudy and rainy weather.  I thought I would take a look at the longest such stretches ever recorded in Victoria.


Let's start with precipitation.  The greatest number of consecutive days with measurable rainfall at the Victoria Gonzales weather station was 29 days: November 2-30, 2006.  Keep in mind that this doesn't mean it rained non-stop for 29 days; it just means that there was at least 0.2 mm of rain measured during each of those days.  That means it could be sunny all day, then a brief sprinkle of rain in the evening, and it would still be considered a day with measurable precipitation.  In fact, there was nearly 40 hours of sunshine recorded during this 29-day rainy streak, an average of nearly 1.4 hours per day.   Nonetheless, 29 days in a row with measurable rainfall is a long stretch!  The second longest stretch was 23 days and the third longest was 20 days.

On the flip side, the longest stretch without precipitation was 63 days, from June 15 to August 16, 1926.  The second longest stretch was 54 days, from July 17 to September 8, 1986.  During that stretch, there were 605 hours of sunshine recorded, or an average of 11.4 hours per day.  The third longest dry streak was 51 days, from July 7 to August 26, 1951.  Although shorter, that stretch came with even more sunshine: 653 hours, or an average of 12.8 hours per day.  There was a tie for the fourth longest dry streak: 46 days in both 1985 and 1991.  The latter streak is unusual in that it didn't occur during July or August; it was from September 1 to October 16, 1991.  Lengthy dry streaks are quite common in Victoria during the summer drought period.  Over the past 105 years, the average summer dry streak in Victoria has been 29 days.

Consecutive sunless days are actually much less common in Victoria than consecutive days with rainfall.  The longest stretch of days with no measurable sunshine was 9 days, from January 6-14, 1967.  You only need to have 0.1 hours of sunshine - 6 minutes - in a day in order for it to be considered a day with measurable sunshine, so you can see why really long stretches might be uncommon.  However, even if you look at consecutive days with less than 1 hour of sunshine, the longest stretch is still only 10 days, from December 8-17, 1980.  The longest stretch of days with less than 2 hours of sunshine is 12 days, recorded in both 1953 and 1971.  So you can see that long stretches with little or no sunshine are actually quite rare in Victoria.


Finally, if you look at the longest stretch of days with measurable sunshine, it was 124 days from May 27 to September 27, 1986.  Perhaps not surprisingly, this period included the record breaking 54 day dry streak discussed above.  Measurable sunshine is a pretty low bar, since you only need at least 0.1 hours of sunshine each day.  If you look at number of consecutive days with at least 8 hours of sunshine, the record is 32 days, from July 17 to August 17, 1977.  During this very sunny period, there were 434 hours of sunshine, and in fact all but one day during this period had more than 10 hours of sunshine and all but 5 days had more than 13 hours of sunshine.   Another remarkable sunny stretch occurred in 1985, when there was 635 hours of sunshine from June 15 to July 29, an average of 14.1 hours per day.  There was just one day during this 45-day stretch with less than 10 hours of sunshine, and a total of just 3 days with less than 12 hours of sunshine.  Perhaps not surprisingly, this stretch included most of July 1985, which was the sunniest calendar month on record at Victoria Gonzales, with 426 hours of sunshine.


Tuesday, January 26, 2016

What's the chance of rain and the likelihood of sunshine throughout the year in Victoria?

The chart below shows the % chance of precipitation and the % of possible sunshine on any given day during the year in Victoria.  It's really striking how the likelihood of precipitation and sunshine form a mirror image of each other.


Let's start by looking at the blue line - the chance of precipitation on any given day.  This starts in the 50-60% range during January and February, drops below 50% in March, and gradually declines until it reaches about 20% in June and early July.  Then we see something that is very distinctive of the climate in our area - a sharp drop down to about a 10% chance of rain on any given day from roughly the second week of July until mid-August.  That's definitely the time to plan your camping trip or outdoor event if you want to almost guarantee dry weather!  Beginning in mid-August, the chance of rain begins to increase, back to about 20% by the end of August, then gradually increases to about 25% by the end of September.  Unlike the spring, when there is a very gradual decrease in the likelihood of rain, the increase in the fall is much more abrupt, doubling from roughly 25% at the end of September to more than 50% by the end of October.  November and December put the chance of precipitation back in the 50-60% range where they started the year.

This pattern is quite different from other locations in Canada.  In Toronto, for example, the chance of precipitation on any given day varies much less throughout the year, from a high of about 50% during the winter months dropping to 30-35% during the summer.  The pattern is even more different in the Prairies.  In Calgary, there is only a 20-25% of precipitation on any given day during the winter months, but that increases to a 40-50% chance during June and July.

As I mentioned earlier, the % of possible sunshine in Victoria - the red line on the chart - follows almost the exact opposite pattern that chance of precipitation does throughout the year.  Victoria gets less than 30% of possible sunshine in December and January.  This gradually increases to about 60% by the beginning of May and stays at that level until the very beginning of July.  Then just as the chance of precipitation plummets from 20% down to 10% in the second week of July, the % of possible sunshine shoots up from about 60% to over 80%.  Again, this is the time to plan those outdoor activities!  The % of possible sunshine begins to drop off in the second week of August, and by the end of the month it is back down around 60%.  Possible sunshine declines very gradually at around 55% through September and the first half of October, then there is a sudden drop down to 30% by the beginning of November.  I've always noticed that the first half of October tends to have much nicer weather in Victoria than the second half -there's often a very abrupt change midway through the month - so it was nice to see this validated by the statistics!

In some ways, the seasonal pattern of sunshine in Victoria is quite similar to that in Toronto, where % of possible sunshine varies from about 30% during November, December, and January then gradually increases to around 60% in July before gradually declining once again.  The big difference is that Toronto doesn't experience Victoria's very high midsummer sunshine levels (80%).  So why is that?  As I explained in this post, the main reason is the North Pacific High, which tends to park itself over the northeastern Pacific in the summer months, deflecting weather systems to the north and providing Victoria with sunny, dry weather.  This is enhanced by the Olympic Mountain rain shadow and by Victoria's location surrounded by the cool water of the Strait of Juan de Fuca, which inhibits the formation of convective clouds and thunderstorms, resulting in exceptionally clear skies in the summer.  That's also why Victoria holds the record for the sunniest month ever recorded in Canada, outside the far north (in fact it holds the top three spots).

I should just mention one more thing.  While I have talked about the chance of precipitation and the % of possible sunshine as forming mirror images of each other, you should note that the way we're measuring chance of rain versus chance of sun is quite different.  For precipitation, we're looking at the % chance of any measurable precipitation on a given day.  That means a day where it there is a light shower for 10 minutes resulting in 0.2 mm of rain would be classed as a day with precipitation.  On the other hand, for sunshine we are not looking at the % chance of measurable sunshine, we are looking at % of possible sunshine.  The % chance of measurable sunshine would be much higher: throughout the year, Victoria averages about 51% of possible sunshine, but on average there is measurable sunshine (at least 0.1 hours) on 317.7 days, or 87% of days during the year.    So just keep in mind that while the chart above might make it seen like the likelihood of rain and sunshine is about the same in Victoria - just a mirror image - in fact we get a lot more hours of sunshine annually than we get daylight hours with rainfall.

Wednesday, January 13, 2016

A nice rain shadow yesterday

I've mentioned how the Olympic Mountain rain shadow has such a profound impact on Victoria's climate.  Thanks to this effect, the Victoria Gonzales weather station averages only 641 mm of precipitation annually, compared  more than 1000 mm in Metchosin (20 km west) and more than 3500 mm at Port Renfrew (80 km west on the exposed southwest coast of Vancouver Island).

Yesterday, we had a good example of a rain shadow.  Here's what the radar looked like around midday yesterday:


You can see there is a pretty clear hole in the rain over Victoria, as well as the northeast Olympic Peninsula.  That "hole" persisted for most of the day and there were only a couple of light sprinkles.  Meanwhile, there was steady rain all day up at the Victoria Airport, with rain recorded every hour from 4 am until midnight yesterday.

The precipitation totals from yesterday also tell the story.  There was just 1.4 mm of rain at Victoria Gonzales and 1.5 mm of rain at the University of Victoria weather station.  At the Esquimalt weather station, about 8 km west of Gonzales, there was 5 mm of rain.  At the Victoria Airport, 25 km north of Victoria, there was more than 14 mm of rain - ten times the amount that fell at Gonzales.  Rainfall totals at up-Island locations were even higher: 26 mm in Duncan, 24 mm in Nanaimo and 28 mm in Campbell River.

The rain shadow tends to be centered over the eastern part of the Strait of Juan de Fuca, as shown in the map below from the informative website OlympicRainShadow.com.


Sequim and Port Townsend, Washington, which are located closest to the center, feel the greatest impact from the rain shadow.  Port Townsend averages only 484 mm of annual precipitation, while Sequim receives a mere 407 mm.  A little further west, Port Angeles averages 642 mm - roughly the same as Victoria Gonzales.  The rain shadow area is not static; it tends to wobble around, so sometimes Victoria is in the rain shadow while other times it is just off to our southeast.  Because Victoria is on the northwestern edge of the rain shadow, areas immediately to our west and north see little or no impact from it (although areas to the north, including the Victoria Airport and the Gulf Islands, do benefit from the less potent rain shadow produced by the lower Vancouver Island mountains).

The Victoria Gonzales weather station is located in that part of the Victoria region that is most impacted by the rain shadow.  Interestingly, the Victoria School-Based Weather Station Network opened a weather station on Trial Island in 2013.  Trial Island is located off the south coast of Oak Bay, about 2 km southeast of Victoria Gonzales, so it is the piece of land in the Victoria Region that is closest to the rain shadow.  Annual data for 2014 and 2015 show that the Trial Island station received only about 400 mm of rain in each of these years, substantially lower than Gonzales.  I'm not sure how accurate these measurements are, and I suspect they may underestimate the rainfall at Trial Island somewhat, but it is likely that the Trial Island weather station occupies the driest site measured on the British Columbia coast, a title long held by Victoria Gonzales.

Friday, January 8, 2016

Does Victoria have a Mediterranean Climate?

You may have seen Victoria described as having a Mediterranean or perhaps a sub-Mediterranean climate.  Is this just local boosterism?  People are sometimes skeptical about these claims of a Mediterranean climate.  After all, while we have great weather in Victoria, it’s not exactly southern California or the Greek Islands.  Despite the skepticism, there is in fact truth to these claims. 

The Koppen classification system, developed by Russian German climatologist Wladimir Koppen in the late 19th century,  is one of the most widely used climate classification systems in the world.  Under the Koppen system, the world’s climates are classified into five main groups: A – Tropical, B – Dry, C – Temperate, D – Continental, and E – Polar.  Victoria falls in the the Temperate group, which is further classified based on the annual precipitation pattern, indicated by the second letter in the classification: s for dry summer, w for dry winter, and f for precipitation throughout the year.   So Cf would include Oceanic climates, like London, England, while Cs climates are termed Mediterranean.  To meet the criteria for a Cs climate, summer months must have less than one third the precipitation as the wettest winter month, and summer months must have less than 30 mm of precipitation.  Victoria easily meets these criteria, with July rainfall of just 13 mm – less than one tenth of our wettest month in December.  Mediterranean climates are further classified as Csa or Csb, depending on whether summers are hot (mean monthly temperature above 22 C) or warm (mean monthly temperature below 22 C).  Based on all these criteria, Victoria’s climate is classed as Csb, or warm summer Mediterranean.  Other locations with a Csb climate include San Francisco, Cape Town, and Porto, Portugal. 

The charts below show the monthly precipitation in Victoria, San Francisco, and London, England.  All three cities have roughly similar total annual precipitation - about 600 mm.  However, while precipitation in London is evenly distributed throughout the year, Victoria and San Francisco have the distinctive Mediterranean pattern of winter rainy season and summer drought   While Victoria's summer drought period is not quite so intense as San Francisco's, the overall pattern is still the same.


Further evidence of our Mediterranean climate can be seen in Victoria’s native vegetation, which tends to be a strong expression of the local climate.   While the vegetation of northern and western Vancouver Island can be classified as temperate rainforest, the southern and eastern coasts of the Island have a drier Coastal Douglas Fir Ecosystem.  In the driest parts of this ecosystem, particularly around Victoria, a sub-class – Garry Oak Meadow – can be found.  This is essentially a temperate savannah, with clumps of oak forest interspersed with meadows and more open prairies.  The Garry Oak is the only native oak tree in Western Canada.  Garry Oak Meadow is now an extremely rare and threatened ecosystem in Canada since most of it has been covered by development in the Victoria area.  The picture below shows a Garry Oak meadow in Uplands Park near Victoria, taken in April when the wildflowers are blooming and before the meadow dries out during the summer drought.    


This type of ecosystem can be found in Oregon’s Willamette Valley, and also stretches down into parts of central California.   Sometimes when I have been driving down in California I will pass through an area of low hills covered with golden grass and clumps of oak trees, and it is striking how much it looks like the undeveloped parts of Victoria in the summer.

The following quote is an indication of how different the natural vegetation in Victoria is from surrounding regions along the B.C. coast.  It comes from Sir James Douglas, the first Governor of Vancouver Island, when he was surveying the region for a potential location for Fort Victoria in February 1843:

“The place itself appears a perfect ‘Eden’ in the midst of the dreary wilderness of the North west coast, and so different is its general aspect from the wooded, rugged regions around that one might be pardoned for supposing it had dropped from the clouds into its present position.”

Douglas chose the site because it was surrounded by so much open meadow and prairie land.  Douglas was visiting Victoria in the spring, and seeing the luxuriant growth of the meadowland, he assumed that the area would be perfect for growing crops through the summer months, writing that  “the climate being also mild and pleasant, we ought to be able to grow every kind of grain raised in England”.   After his first summer in the region, Douglas had learned that Victoria’s dry summers would make agriculture more challenging than he’d originally thought, writing in a letter dated November 1843 that  “no rain fell between the 10th of June and 8th September at Fort Victoria” and that the residents of Victoria were “at times badly off for water”.