Sunday, January 15, 2017

Victoria's Cold Snap of 2016-17

December and early January is the coldest time of the year in Victoria, but the past six weeks have been unusually cold this winter.  Since December 5, the average daily high temperature at Victoria Gonzales has been has been just 4.4 degrees (compared with the normal high of 7.3 for this period), while the average daily overnight low has been very chilly 0.2 degrees (compared with the normal overnight low of 3.4).  As a result, the overall mean temperature in Victoria over the past six weeks (December 5 to January 15) has been just 2.3 degrees - a full 3 degrees below the normal.  For Victoria, where temperatures tend not to deviate too much from the mean, that is a very significant deviation over such a long period of time.  In fact, we've just finished the coldest 6-week spell in Victoria in over 30 years.  The last time we had a six week stretch this cold was back in November-December 1985.

The chart below shows the daily mean temperatures at Victoria Gonzales over the past six weeks with the 30-year average temperatures for the same period.  You can see that, except for a few days in mid- and late-December, temperatures have generally been well below average.  However, there have been significant fluctuations, with a cyclical pattern of a few cold days followed by a short rebound to close to normal temperatures.

Daily mean temperatures for Victoria  in 2016-17 vs. 30-year average
During this cold snap, overnight temperatures dipped below freezing 21 times - half of the nights in the past six weeks.  Normally, Victoria Gonzales would see freezing temperatures an average of just 5 times during this period.  While we had a lot of days with frost, the temperatures really didn't get that cold during this cold snap - even by Victoria standards.  The coldest temperature recorded during the period was -3.8 degrees on December 17 (and there were only three other days when the temperature dropped below -3).  Victoria gets down to -3.8 most winters (16 of the past 30 winters, for example).  In fact, Victoria has dropped below -6 in 10 of the past 30 winters.

Daytime highs were also well below normal.  Victoria Gonzales even saw one day - January 3 - when the daytime high failed to reach the freezing mark (it was -0.3 degrees).

While it's been cold in Victoria, other locations around the region have been even colder than Victoria Gonzales' mean of 2.3 degrees.  Out at the Victoria Airport, the mean temperature was just 1.0 degrees during this period, and below-freezing temperatures were recorded on 34 nights.  In Vancouver, the mean temperature was a very cold -0.2 at the Airport, although it was a milder 1.7 degrees downtown at the Vancouver Harbour.  Vancouver Airport saw 34 days with overnight lows below freezing and three days when the daytime highs failed to reach the freezing mark.  In Seattle, the mean temperature was 1.9 degrees.   The table below summarizes the average temperatures during the cold snap.


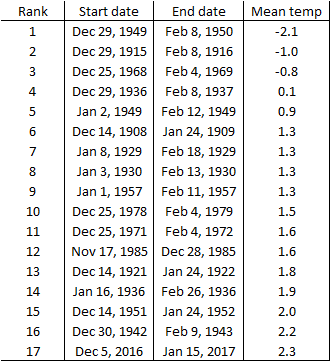
As mentioned above, this is the coldest six week period we've had in Victoria in the past 30 years.  While there haven't been cold snaps like the one we've just experienced in the recent past, they did used to be more common in Victoria.  The table below the coldest six week periods recorded in Victoria over the past 100 years.  I have listed all the cold snaps that were colder than the one we've just experienced.  You can see that the 2016-17 cold snap was the 17th coldest six week period recorded at Victoria Gonzales over the past century.  While the average temperature of 2.3 degrees has seemed very cold, Victoria's coldest cold snap (in 1949-50) was a bone-chilling -2.1 degrees!  Victoria has experienced two other cold snaps when the mean temperature over a six week period has been below freezing (1915-16 and 1968-69).


Monday, January 2, 2017

Almost another record-breaking year in Victoria.

2015 was the warmest year ever recorded in Victoria.  For most of the past year, it looked like 2016 might be even warmer.  The mean temperature in Victoria for January to November 2016 was 12.2 degrees, compared with 12.1 degrees for the comparable period in 2015.   That makes January to November 2016 the warmest 11 month period on record in Victoria.  If Victoria had just experienced average temperatures in December, then 2016 would have set the new record for warmest year.  Instead, December turned out to be one of the coldest Decembers in the past 30 years.  As a result, 2016 ended up being tied with 2004 for the second warmest year on record in Victoria, with a mean temperature of 11.5 degrees (versus 11.7 degrees in 2015).

Victoria still experienced impressive warmth in 2016.  That mean temperature of 11.5 degrees is almost a full degree above the 30-year average of 10.6 degrees.  It's also pretty amazing that we followed up the warmest year on record in 2015, with the second warmest year on record in 2015.  in addition, 10 of the 12 months in 2016 were warmer than normal, and we also beat a couple of monthly records: in 2016 we had both the warmest April on record and the warmest November on record.

The chart below compares the daily maximum and minimum temperatures for 2016 at Victoria Gonzales with the long term average temperatures.  You can see that for most of the year, we were well above the average.  Only in December did temperatures fall below the average for a significant period.


Daily max & min temperatures in Victoria, 2016

While temperatures were much warmer than average in 2016, precipitation ended up being much closer to normal.  Victoria had 623 mm of precipitation in 2016, just slightly below the average of 641 mm.  While the amount of precipitation was below average, the number of days with measurable rainfall was actually above average: 153 days in 2016 versus the average of 140 days.  The wettest day - by far - was February 15, when Victoria received a deluge of 61.6 mm of rain.  That's nearly 10% of our annual rainfall in one day.

The chart below compares the daily and cumulative precipitation in 2016 with the average cumulative precipitation.  You can see that we stayed fairly close to the average throughout the year, following our typical pattern of wet winters and dry summers.

Daily and cumulative precipitation in Victoria, 2016

Victoria typically receives less rainfall than surrounding areas, and in 2016 this pattern was even more pronounced than usual.  The chart below compares total annual precipitation for a number of cities in our region.  Compared with 623 mm  of precipitation at Victoria Gonzales, the Victoria Airport received 1006 mm - 60% more than Victoria proper.  Nanaimo (1370 mm) received more than twice as much rain as Victoria in 2016 while Vancouver (1618 mm) received more than 2.5 times as much rain.  Seattle (1148 mm) received more than 80% more rainfall than Victoria.  While Victoria was received slightly below average precipitation in 2016, all these other cities were wetter than average this past year.


A Cold December in Victoria

Since the beginning of 2014, has had an almost continual string of above average monthly temperatures.  Through November 2016, 31 of the previous 35 months were warmer than the long-term average, and of the four months that were cooler, three were only slightly below the average.  December 2016 was much colder than normal in Victoria, with a mean temperature of just 3.3 degrees - a full two degrees colder than the average of 5.3 degrees.  That made it the third coldest December in Victoria in the last 30 years. This past month was also the coldest of any month since 2008.  There were 11 days when the overnight low fell below freezing, compared with the normal of 2.9 days.  The coldest temperature of the month was -3.8 degrees on December 17, while the warmest temperature was 9.5 degrees on December 2.

The chart below compares this December's maximum and minimum temperatures at Victoria Gonzales with the 30-year average.  You can see that except for a handful of days, temperatures were well below normal for much of the month.  On several days, the daily maximums were below the normal minimums for that day.

Daily Max & Min Temperatures in Victoria, December 2016

As mentioned in the previous blog, snow also returned to Victoria in December, for the first time in nearly five years.  In total, there was 8 cm of snow during the month, with most of that falling on December 9.  There was one day during the month with significant (more than 2 cm) of snow on the ground - again on December 9.  Perhaps surprisingly after the snow-free weather we've experienced over the past several years, this December's snowfall was actually slightly below the 30-year average for December of 9 cm.  However, the average snowfall in December is skewed by a small number of large snowfalls - particularly the huge dump (over 100 cm) of December 1996.  If you don't count that one year, average December snowfall would drop to 5.5 cm.

December was wetter than average, with 120 mm of precipitation, compared with the average of 95 mm.  There were 21 days with measurable precipitation during the month, compared with the December average of 18 days.  The chart below compares daily and cumulative precipitation in Victoria during December 2016 with the 30-year average cumulative precipitation.  You can see that we ended the month with about 25% more precipitation than average.

Daily and Cumulative Precipitation in Victoria, December 2016

Saturday, December 31, 2016

Snow returns to Victoria after 1,785 snow-free days!

After a very long snow drought, snow finally returned to Victoria in December 2016.

It started with a light dusting on December 5 - about 2 cm, but not enough to cover the grass.  Then on December 9, Victoria received about 5 cm of snow - its first significant snowfall since 2012. Here's a photo of the Inner Harbour area taken on my way to work, around 7:30 that morning:


As is usually the case in Victoria, the snow didn't last long.  By the afternoon, the melting was well under way.  Here is another photo, taken about 4:45 pm, on my way home from work, and you can see that the grass is already showing on the lawn in front of the Legislature.  By the next morning, the snow had all melted.


When I refer to significant snow, I mean more than 2-3 cm and enough to completely cover the ground (and the grass).  The last time we had snow covering the ground in downtown Victoria was January 17-20, 2012.  That's 1,785 days without significant snow on the ground!  While official "snow depth on the ground" measurements were only made at Victoria Gonzales from 1955 to 1988, I'm pretty sure that is a record for Victoria -  nearly five years with no significant snow on the ground!

I noticed that some of the local media were referring to 1,000 days without significant snow, but they were basing that on the "official" record out at the Victoria Airport.  Unfortunately, the Airport gets much more snow than downtown - more than twice as much.  There was quite a lot of snow out at the Airport back in February 2014 (1,000 days prior to the recent snow) but Victoria did not get that snow.  In fact, here is a photo I took on February 23, 2014, a day when there was 21 cm of snow recorded out at the Victoria Airport:


In our most recent bout of snow, we did receive a couple more very light dustings (less than 1 cm) on December 12, and again on December 17.  But really, we ended up with just one day with actual snow on the ground (December 9).  That's sure a lot better than some areas up-Island and in the Vancouver suburbs, where there was almost  continuous snow on the ground for up to 3 weeks!  We are very lucky in Victoria, that so often we can be snow free when there is snow all around us.  To illustrate, here is a map from NOAA showing snow cover in our area on December 16.  You can see that the core area of Victoria has no snow, while there is snow up on the Saanich Peninsula, the Gulf Islands, all the rest of Vancouver Island, and the Vancouver area.


Fall 2016 - October and November in Victoria

It's been a while since I've posted, so I'm trying to get caught up.  I'll start with a brief look at the weather in Victoria for October and November 2016.

October: a bit milder and much wetter than normal

October was a bit warmer than average, with a mean temperature of 11.5 degrees at Victoria Gonzales versus the 30-year average of 11.1.  The mean daily high and low temperatures for the month were 14.0 / 8.9 versus the normal average of 13.9 / 8.2, so the daily high temperatures averaged only very slightly above the normal while the daily low temperature was more significantly above the normal.  The warmest temperature during the month was 18.0 on October 5th while the coldest was 5.6 on the 12th.

October was also wetter than normal, with 116 mm of rain, nearly 50% more that the normal of 79 mm.  The wettest day was 21.2 mm on October 20th.  Overall, there was measurable rain on 21 days during October, much more than the normal 12.4 days.  While it was wet at Victoria Gonzales, it was much wetter up at the Victoria Airport in North Saanich, which saw 234 mm of rainfall during the month - double what Victoria proper received.

November: record-breaking warmth and fairly dry

November 2016 was very mild in Victoria - in fact it was the warmest November ever recorded at Victoria Gonzales.  The mean temperature for the month was 9.9 degrees -  more than two degrees above the 30-year average of 7.6 degrees.  The old record for November was 9.3 degrees, recorded in both 1949 and 1954, so November 2016 topped that by a fairly large margin.  The mean daily high and low temperatures for the month were 11.9 / 7.7 versus the normal average of 9.9 / 5.4, so both daytime highs and overnight lows were well above normal.  The warmest temperature during the month was 16.8 degrees on November 8th while the coldest was 4.0 on the 27th.

November 2016 was also significantly drier than normal, with just 78 mm of rain - nearly 40% less than the normal of 127 mm.  However, there was measurable rainfall on 20 days during the month, which is actually a bit higher than the average of 18 days - so quite a lot of rainy days but not much heavy rain.  The wettest day was 16 mm on November 5th.  As in October, November was much wetter up at the Airport, which received 176 mm of rainfall during the month - considerably more than double what was recorded at Victoria Gonzales.  The pattern this month seemed to be a lot of days with just very light rainfall in Victoria - much less than in surrounding areas.

Sunday, October 16, 2016

A fairly normal September

September was slightly wetter and slightly cooler than normal in Victoria, but nothing too extreme.

Rainfall for the month was 27.6 mm, a bit more than the 1981-2010 average of 23.9 mm for September at Victoria Gonzales.  There were 9 days with measurable rainfall (compared with the normal of 6.5 days), with the highest amount (11.6 mm) on the 17th.  The Victoria Airport received just slightly more rainfall in September, 31.1 mm.

The mean temperature was a bit lower than the 1981-2010 average: 14.2 degrees versus 14.6 degrees.   September 2016 ended a nine month streak of above average monthly temperatures at Victoria Gonzales: it was the first month since November 2015 to be below normal temperature.  While September was a bit cooler than the average for the past 30 years, if you look at the past 119 Septembers at Victoria Gonzales, this month's temperature falls almost exactly middle of the pack (i.e. the median).  The average daily max and min temperature this September was 17.6/10.6.  The average max temperature was about one degree below normal, but the average min temperature was right on the normal.  The highest temperature for the month was 22.9 on the 13th while the lowest was 6.6 on the 30th.  At the Victoria Airport, the mean temperature was 14.3, which was slightly higher than the 30-year average of 14.1.

Saturday, September 3, 2016

A look back at summer 2016

Now that August is over, meteorological summer (June, July, and August) is also over.  Summer 2016 started out a little more unsettled than usual in Victoria, but in the end it turned out to be very nice.

At Victoria Gonzales, there was a total of 41 mm of rain during June, July, and August.  That's a little drier than the 50 mm that Victoria receives on average during the summer, but nothing unusual.  In fact, about 40% of the summers at Victoria Gonzales over the past 118 years have been drier, with the driest summer (1970) receiving just 10.5 mm of rain during June, July, and August.  While this June was a little wetter than normal, July and August were both a little drier.  There were 15 days with measurable precipitation during the summer, which is right on average.

The chart below shows daily rainfall during summer 2016, and compares the cumulative rainfall with the 30-year average.  You can see that June and the first week in July was generally a little wetter than average, but then it was very dry until the last few days in August.  From July 10 to August 27, there was a seven week stretch with just one day and only 1 mm of rain, and from July 23 to August 27, there was a 36-day period with no measurable precipitation.  That's a little longer than the typical drought period that Victoria receives each summer, which averages 28 days.

Daily and cumulative rainfall, 2016 vs 30-year average

The chart below compares Victoria's rainfall during summer 2016 with a number of other locations.  Compared with Victoria Gonzales' 42 mm, the Victoria Airport actually received slightly less rain, at 38 mm.  In Vancouver, there was 105 mm at the Airport and 156 mm downtown at the Harbour (so nearly four times as much rain as Victoria).  Up-Island also had more rain than Victoria, with 115 mm at Nanaimo and 95 mm at Comox.  Rainfall in Seattle was closest to Victoria, although there was still nearly twice as much, with 68 mm.  Finally, I have included Toronto's 133 mm.  There was a lot of coverage in the news about the drought affecting Southern Ontario, so this shows that everything's relative: even with one of the worst droughts in memory, Toronto still received more than three times as much rain as Victoria this summer.

Total rainfall, summer 2016
Now lets talk about temperatures.  The mean temperature for June, July, and August at Victoria Gonzales was 16.4 degrees, substantially higher than the 30-year average of 15.6.  In fact, summer 2016 was the 6th warmest in 119 years of record-keeping at Gonzales.  (Last year's summer, at 16.9 degrees, was the warmest on record.)  June's mean temperature of 15.5 degrees was 1.0 degrees above normal, while July's mean of 16.1 degrees was right on normal.  It was August when things really heated up: the mean temperature of 17.5 was 1.2 degrees above normal and just 0.1 degrees below the all time record.  In fact, at the Victoria Airport it was the hottest August on record.

The chart below shows the daily maximum and minimum temperatures at Victoria Gonzales during summer 2016, compared with the 30-year averages.  You can see that there were spikes of above average temperatures in June and again in August, while temperatures in July stayed very close to the average.  The warmest temperature of the summer was 33.1 degrees on August 19.

Daily maximum and minimum temperatures at Victoria Gonzales , summer 2016