Wednesday, May 2, 2018

A wet April in Victoria

As was the case in March, April in Victoria had close to normal temperatures, but while March 2018 was much drier than normal, April 2018 was much wetter than normal.

The mean temperature for April 2018 was 9.9 degrees at Victoria Gonzales, right on the 30-year average.  The average daily high temperature of 12.9 degrees this year was half a degree below the normal of 13.4, while the average daily low temperature of 6.8 degrees was half a degree above the normal of 6.3 degrees.  The warmest temperature of the month was 24.9 degrees on April 26th.  That's the fourth warmest monthly maximum temperature ever recorded at Victoria Gonzales, with the warmest being 27.0 degrees in April 1998.  Victoria Gonzales averages about 1 day in April with maximum temperatures above 20 degrees; this year there were 3 days.  The coldest temperature was 2.5 degrees on April 2nd, which is a fairly typical monthly minimum for April.

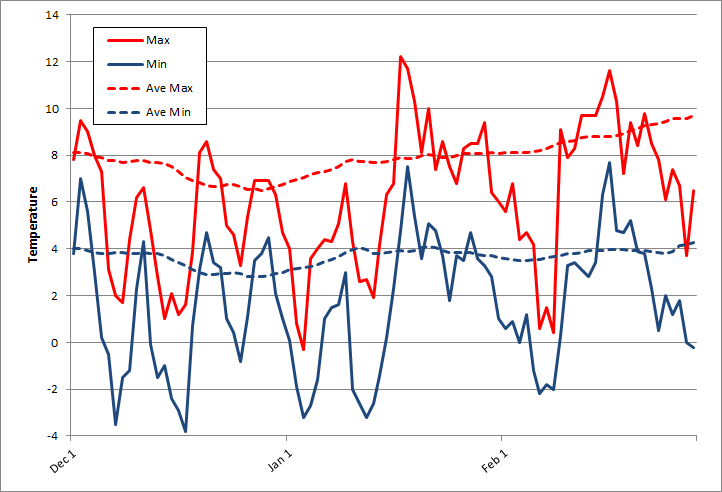
The chart below shows the daily maximum and minimum temperatures this April compared with the long term averages.  Generally, temperatures have fluctuated around the averages, although you can see a period of below average temperatures mid-month, followed by a mini-heatwave that occurred April 23-26.

Daily Max & Min Temperatures in Victoria, April 2018


While temperatures were close to normal, precipitation was well above normal, with 62 mm of rainfall at Victoria Gonzales in April, nearly double the 30-year average of 33 mm.  This was the ninth wettest April on record at Victoria Gonzales (with records going back 105 years).

The chart below shows the daily and cumulative precipitation in Victoria this April, compared with the average cumulative precipitation.  Clearly, rainfall was well above normal, particularly in the first half of the month.  There was measurable precipitation (more than 0.2 mm) on 15 days this April, compared with the normal of 10 days.  The wettest days were the 4th (when 13.2 mm of rain fell) and the 16th (12.2 mm).

Daily & Cumulative Rainfall in Victoria, April 2018


As is typical, other locations in the region were even wetter than Victoria Gonzales in April.  The Victoria Airport recorded 98 mm of rain in April, while Nanaimo recorded 113 mm (about double Victoria).   Vancouver Harbour recorded 179 mm of rain in April - nearly three times as much rain as Victoria, which is fairly typical.  Seattle recorded 145 mm of rain in April.


Thursday, April 5, 2018

Winter in April

Despite all the flowers blossoming around town, yesterday was a very winter-like day in Victoria.  The high yesterday was just 6.7 degrees.  That's more than 5 degrees below the normal high for April 4 of 12.2 degrees.  That's even below the average 7.2 degree high for December, Victoria's coldest month.  It was definitely chilly!  There have only been two April days in the past 50 years that were colder than yesterday.

It was also quite wet, with 13.2 mm of rain.  That's about 40% of the normal rainfall for the entire month of April.  It seemed especially rainy after the dry March that we just experienced.  In fact, the 13.2 mm of rain yesterday was almost as much as the 13.6 mm recorded in the entire month of March this year.

The normal average high temperature for April is 13.4 degrees, while average rainfall is 33 mm with measurable precipitation on 12 days.  Rain is recorded at Victoria Gonzales 11% of the time during April, while sunshine is recorded 52% of daylight hours.  Hopefully, we'll get back into our more typical warmer, drier and sunnier April weather soon!

Sunday, April 1, 2018

March 2018 - typical temperatures but very dry

In terms of temperature, March was pretty close to normal in Victoria.  The mean temperature for the month was 7.6 degrees at Victoria Gonzales, just slightly below the 30-year average of 7.8 degrees.  The average daily high temperature of 10.8 degrees this year was actually right on normal, but the average daily low temperature of 4.4 degrees was below the normal of 4.8 degrees.  The warmest temperature of the month was 16.4 degrees on March 12th, and the coldest temperature was 2.0 degrees on March 25th.  On average, about one in every six years it drops below freezing in March at Victoria Gonzales, but this year was not one of those years.  (The last time it was below freezing in March at Victoria Gonzales was March 2009.

The chart below shows the daily maximum and minimum temperatures this March compared with the long term averages.  Generally, temperatures have fluctuated around the averages. 

Daily Max & Min temperatures in Victoria, March 2018


While temperatures were close to normal, precipitation was well below normal, with just 13.6 mm of rainfall at Victoria Gonzales in March, only 27% of the 30-year average of 50 mm.  In fact, this was the fourth driest March on record at Victoria Gonzales (with records going back 105 years). 

The chart below shows the daily and cumulative precipitation in Victoria this March, compared with the average cumulative precipitation.  Clearly, rainfall was well below normal.  There was measurable precipitation (more than 0.2 mm) on 8 days this March, compared with the normal of 14 days.

Daily & cumulative precipitation in Victoria, March 2018
Other locations in the region weren't nearly as dry as Victoria.  The Victoria Airport, which normally gets about 55-60% more March precipitation than Gonzales, had more than twice as much rain as Gonzales this year: 30.7 mm (though this was still less than half the normal amount at the Airport).   Other locations were even wetter, with 51 mm at Nanaimo, 62 mm at Seattle, and a whopping 142 mm at Vancouver Harbour.  Vancouver normally gets about 3 times as much rainfall as Victoria in March, but this year it recorded 10 times as much!  Below is a chart comparing March precipitation at several locations in the region.


Finally, there was no snow in Victoria in March.  This is not unusual.  The average March snowfall at Victoria Gonzales is just 1 cm, and there is no snow in March in Victoria more than 60% of the time.  The last time there was measurable snow in March in Victoria was 2009.

Saturday, March 24, 2018

A look at winter 2017/18 in Victoria

Meteorological winter (December to February) finished a few weeks ago.  So what was the winter of 2017/18 like in Victoria?  Unlike the very warm winters of 2014/15 and 2015/16, followed by the extremely cold winter of 2016/17, this past winter was closer to normal, though still a bit cooler and wetter than the 30-year average.

The mean temperature over the three month period was 5.4 degrees - cooler than the 30-year average of 5.8 degrees, but nothing too unusual.  This follows the extreme cases of 2014/15 (mean winter temperature of 7.6 degrees), 2015/16 (6.8 degrees), and 2016/17 (just 3.9 degrees).  The average daily max/min temperature this past winter was 7.4/3.3 (compared with the normal 7.9/3.6).  The warmest temperature was 12.8 on February 4th and the coldest was -2.2, also recorded in February, on the 21st.  There were 10 days when the temperature dropped below 0 (4 days in December, none in January, and 6 in February).  The 30-year average for Victoria Gonzales is 7.6 days with overnight temperatures dropping below freezing during the winter.

The chart below shows the daily maximum and minimum temperatures this winter, compared with the 30-year averages.  The first half of December was fairly mild, then it turned cold in late December.  January was generally quite mild, with temperatures just above normal.  February started out mild, then turned much colder towards the end of the month.

Daily Maximum & Minimum Temperatures, Winter 2017/18

This winter was also a little wetter than normal.  Total precipitation from December to February was 308 mm, compared with the 30-year average of 264 mm.  All three winter months were slightly  wetter than the winter normal.  The chart below shows the daily and cumulative precipitation this winter compared with the average.  Early December was dry, but rainfall totals caught up to normal when 37 mm of rain fell on December 19, the wettest day of the winter.  After that, cumulative precipitation stayed slightly above normal.

Daily & Cumulative Precipitation, Winter 2017/18

The 308 mm of precipitation recorded at Victoria Gonzales this winter compared with 399 mm at the Victoria Airport and 655 mm at Vancouver Harbour.

There was 11 cm snow this winter, a little more than half the 30-year average of 20 cm.  We had one snowfall in December (perfectly timed to fall overnight on Dec. 24-25, then all melted by Dec. 26), and one snowfall in February.

Monday, March 5, 2018

2017: A year in review

After two very warm years in 2015 and 2016, average temperatures in 2017 were close to the long term average: 10.5 degrees versus the 30-year average of 10.6 degrees.  The year started out cold, with January and February almost 2 degrees colder than average, and March  nearly 1 degree colder than average.  From April to July, temperatures were close to the average, then August through October was about 1 degree warmer than average.  The year ended with below average temperatures in December.

The warmest temperature of the year was 30.4 degrees on June 24, while the coldest temperature was -3.2 degrees on January 3.  There were 3 days in 2017 with a maximum temperature above 30 degrees, compared with the average of just 1 day.  Conversely, there were 18 days in 2017 with a minimum temperature below freezing, well above the average of 9.5 days.

The chart below compares the daily maximum and minimum temperatures for 2017 at Victoria Gonzales with the long term average temperatures.  You can see that the beginning and the end of the year were colder than average, while the middle part of the year experienced average to above average temperatures.

2017 daily maximum and minimum temperatures

As was the case in 2016, precipitation was close to normal in 2017.  Victoria had 613 mm of precipitation in 2017, just slightly below the average of 641 mm.  The number of days with measurable rainfall was below average: 128 days in 2017 versus the average of 140 days.  There was actually a tie for the wettest day in 2017: both October 18 and December 19 received 37.0 mm of rain.

The chart below compares the daily and cumulative precipitation in 2017 with the average cumulative precipitation.  You can see that we stayed fairly close to the average throughout the year, following our typical pattern of wet winters and dry summers.  July and August are typically very dry in Victoria, and in 2017 they were especially dry, with just 0.8 mm in July and 1.4 mm in August.  The combined 2.2 mm of rain in July and August was the lowest ever recorded at Victoria Gonzales.  January was also a dry month in Victoria in 2017, with just 25.7 mm of rain, making it the 5th driest January on record at Victoria Gonzales.

2017 daily and cumulative precipitation

Victoria typically receives less rainfall than surrounding areas, and 2017 was no exception.  The chart below compares total annual precipitation for a number of cities in our region.  Compared with 613 mm  of precipitation at Victoria Gonzales, the Victoria Airport received 910 mm - 48% more than Victoria proper.  Nanaimo (1048 mm) received 70% more rain thanVictoria in 2017 while Vancouver (1568 mm) received more than 2.5 times as much rain.  Seattle (1216 mm) received twice as much rainfall asVictoria.


Sunday, March 5, 2017

Victoria's cold winter of 2016-17

We've recently come to the end of meteorological winter (December 1 to February 28), and it was definitely an unusual winter in Victoria.  The biggest stand out was the temperature - this past winter was the coldest in 38 years in Victoria.  The last time we had a winter this cold was back in 1978-79.  Victoria has actually experienced 20 winters in the last 120 years that were at least this cold.  However, all of those winters were prior to 1980, so we're just not used to it  any more!

The mean temperature this past winter was 3.9 degrees, roughly 2 degrees below the 30-year average of 5.8 degrees.  The average daily maximum/minimum this winter was 6.1/1.6, again roughly 2 degrees below the normal winter daily max/min of 7.9/3.6. 

The chart below compares the daily maximum and minimum temperatures this winter with the 30-year average temperatures.  You can see that the temperatures were pretty consistently below average, with just a couple of brief spells of milder weather. 

Daily maximum & minimum temperatures in Victoria, winter 2016-17


Victoria experienced 25 days when the temperature dropped below freezing this winter, compared with the average of 8.8 days.  Again, that’s the most days since the winter of 1978/79.  However, the record was 41 days in 1912/13.  While we had a lot of overnight lows below freezing, it never really got that cold in Victoria this winter.  The coldest temperature was -3.8 degrees on December 17.

Conversely, Victoria experienced daytime temperatures above 10 degrees on just 7 days this winter, compared with the average of 20 days.  Last winter (2015/16) there were 28 days above 10 degrees and the winter before that (2014/15) there were 42 such days - six times as many as this winter.  To put it another way, just 8% of winter days this year were above 10 degrees, compared with 47% of winter days in 2014/15.   

The colder weather was partly the result of a number of arctic outbreaks, bringing cold sunny weather to Victoria.  As a result, total precipitation for the winter was below normal: 222 mm versus the 30-year average of 264 mm.  The chart below compares the daily and cumulative precipitation at Victoria Gonzales this past winter with the 30-year normal precipitation.  While December was a bit wetter than normal, January was very dry and February was about average.  The highest daily rainfall was 26 mm on February 9.  Overall, there were 46 days with measurable precipitation this winter, which was right on the average.

Daily & cumulative precipitation in Victoria, winter 2016-17


As usual, Victoria was much drier than surrounding areas, as shown in the chart below.  Compared with Victoria Gonzales (222 mm), the Victoria Airport (315 mm) had 50% more precipitation, while Seattle (430 mm) and Vancouver (469 mm) both had about twice as much. 


Winter 2016/17 brought the first significant snowfall in 5 years to Victoria.  Not surprisingly, snowfall was above normal.  Total snowfall for the winter was 29 cm, almost double the 30-year average of 16 cm for December to February (total annual snowfall averages 20 cm in Victoria).  There was 8 cm of snow in December, just 1 cm of snow in January, and a whopping 20 cm in February (versus normal of 9 cm for December, 3.4 cm for January, and 3.6 cm for February). In terms of days with snow on the ground, Victoria got off not too badly (especially compared with Vancouver and up-Island): there were 5 days with at least 1 cm of snow on the ground this winter compared with the normal of 4.5 days during December to February.

Wednesday, February 1, 2017

A cold and dry January in Victoria

January was another cold month in Victoria, following a cold December, with continued “Arctic outbreaks” of cold dry air from the B.C. Interior, interspersed with periods of milder Pacific air.  The mean monthly temperature of 3.9 degrees was nearly a full two degrees below the 30-year average of 5.8 degrees.  In fact, January 2017 was the coldest January since 1993 - nearly 25 years ago.  The average daily max and min temperature in January was 6.2/1.5, compared with the normal of 7.7/3.8.  The warmest temperature during the month was 12.2 degrees on the 17th, while the coldest temperature was -3.2 degrees, recorded on both the 3rd and the 12th.  The daily maximum exceeded the monthly average of 7.6 degrees on only 10 days this January.  On the other hand, the overnight minimum was lower than the monthly average of 3.8 degrees on 25 days this January.  There were 9 days when overnight lows dropped below freezing, compared with the long term average of 2.9 days.

The chart below shows the daily maximum and minimum temperatures in Victoria this past month, compared with the average temperatures.  You can see that temperatures were below average during the first half of the month (with an average daily max/min of 3.6/-0.9).  The second half of January saw slightly above average temperatures ( average max/min of 8.5/3.9), except for a dip during the last few days of the month.

Daily Maximum and Minimum Temperatures, January 2017


While January 2017 was cold, the frequent Arctic outbreaks meant it was also dry.  There was only 24.7 mm of precipitation recorded at Victoria Gonzales in January.  This is about one quarter of the normal 104 mm, making this January the 5th driest in the past 100 years at Victoria Gonzales.  Victoria saw precipitation on just 8 days in January 2017, compared with the usual 17 days.  Two thirds of the month’s rainfall came in a short 3-day stretch from January 17 to 19.  Despite the cold, there wasn’t much snow in Victoria this January, just a 1 cm dusting on January 1st that melted away by noon.

The chart below shows daily and cumulative precipitation in Victoria this January, compared with the long-term average cumulative precipitation.  You can see that the amount is well below normal.

Daily and Cumulative Precipitation, January 2017


As I’ve mentioned many times on this blog, Victoria tends to get significantly less rainfall than surrounding areas, and this past month that trend was even more evident.  The chart below compares the total precipitation for January 2017 at Victoria Gonzales and a number of nearby locations.  The Victoria Airport, 30 kms to the north, had  more than twice as much precipitation as Victoria Gonzales.  Nanaimo had 3 times as much precipitation as Victoria, Seattle had more than 4 times as much, and Vancouver had more than 5 times as much.  In the winter time, the differences usually aren’t this great.  The Arctic outbreaks we had this month tended to push the jet stream further south, with lots of precipitation going into California.  As a result, Los Angeles, received  over 200 mm of rain - more than 8 times as much as Victoria.