Wednesday, December 12, 2018

Victoria's Fall of 2018: slightly warmer and drier than nomal

November 30 marked the end of meteorological fall (September, October, and November), so it's time to take a look back at the fall of 2018 in Victoria.  Overall, the summer was slightly drier and warmer than normal.  This was due to warmer and drier than normal conditions in October and November, since September was actually slightly cooler and wetter than normal.

Victoria received 186 mm of rain during the September to November period at Victoria Gonzales.  That's about 18% less than the 30-year average fall rainfall of 226 mm.  Rainfall was actually a bit above normal in September (28 mm in 2018 vs. the average 24 mm).  However, this was followed by a drier than average October (50 mm vs. 72 mm) and November (108 mm vs. 130 mm).  

There were 39 days with measurable precipitation this fall, with 11 days in September, 13 days in October, and 15 days in November.  That's actually slightly above the 37 days with measurable rainfall that Victoria typically receives during the fall (7 days in September, 12 days in October, and 19 days in November).  

The chart below shows daily rainfall during fall 2018, and compares the cumulative rainfall with the 30-year average.  September and early October were slightly wetter than normal.  This was followed by a two-week dry spell during the middle of October.  The end of October and beginning of November was the wettest period of the fall, with  nearly half of Victoria's fall rainfall this year being recorded over a 9-day stretch from October 27 to November 4.  This period included the wettest single day of the fall: 19.6 mm on November 1.  The remainder of November was a little drier than normal.


Daily & Cumulative Rainfall in Victoria, Fall 2018
The chart below compares the rainfall amounts in Victoria this fall with other locations in the regions.  As is typically the case, Victoria Gonzales had the lowest amount, with a total of 186 mm.  Victoria Airport had 280 mm mm of rain throughout the fall, about 50% more than Victoria Gonzales.  It was wetter still in Vancouver, with 425 mm at the Vancouver Airport and 552 mm at Vancouver Harbour - nearly 3 times what Victoria received.  By comparison, it was relatively dry in Seattle, with 260 mm.  That's less than Victoria Airport received, but still about 40% more rainfall than Victoria Gonzales.  

Fall 2018 Rainfall


The mean temperature this fall at Victoria Gonzales was 11.4 degrees, warmer than the 30-year average of 11.0.  Fall 2018 was tied for the 21st warmest in 105 years of record-keeping at Gonzales, so only about 1 in 5 falls have been warmer.  (Fall 1987 was the warmest on record, at 12.3 degrees.)  September 2018 was actually a bit cooler than average (14.3 degrees vs. the average 14.6).  However, both October and November were warmer than average.  In October it was 11.2 degrees vs. the average 10.9, while in November it was 8.7 vs. the average 7.5 degrees.  November was the 14th warmest on record at Victoria Gonzales (going back 105 years).  

The chart below shows the daily maximum and minimum temperatures at Victoria Gonzales during fall 2018, compared with the 30-year averages.  You can see that September was generally a bit cooler than average, while October and November were both a bit warmer than average.  The warmest day of the fall was 23.3 degrees on September 5, although it also reached 23.1 degrees on September 28, which was a greater anomaly from the average (which is 17.5 degrees for that date).  The coolest temperature was 2.7 degrees on November 19.


Daily Max & Min Temperatures in Victoria, Fall 2018

Sunday, September 2, 2018

Victoria's Summer of 2018: warmer and drier than average

August 31 marks the end of meteorological summer (June, July, and August), so it's time to take a look back at the summer of 2018 in Victoria.  Overall, the summer was drier and warmer than normal.

Victoria has dry summers, averaging just 52 mm of rain during the June to August period at Victoria Gonzales.  This year, summer was particularly dry, with just 21 mm of rain.  That makes it the 8th driest summer in the past 105 years.  (The driest summer on record was 1970, with just 10.5 mm of rain.)  In 2018, rainfall in June was actually close to average (18.6 mm vs. the average 20 mm), but that was followed by an extremely dry July and August.  There was no rainfall recorded at Victoria Gonzales during July (the sixth time that has happened).  August was also very dry, with just 2.0 mm of rain (all of which fell during a one-hour rainshower on August 11).  August 2018 was the 13th driest on record at Victoria Gonzales, so only about 1 in 8 Augusts have been drier.  This year is notable because the combined July-August rainfall of 2.0 mm was the lowest on record.  Interestingly, the second driest July-August on record was 2017, with 2.2 mm, so we have experienced back to back records for dry July-August periods.

There were 8 days with measurable precipitation this summer, with 7 of those days falling in June.  Victoria typically receives 15 days with measurable rainfall during the summer month (7 in June and 4 each in July and August).  

The chart below shows daily rainfall during summer 2018, and compares the cumulative rainfall with the 30-year average.  June was fairly typical in terms of rainfall, but that was followed by a 41-day stretch with no measurable rainfall from July 1 to August 10.   That's a little longer than the typical drought period that Victoria receives each summer, which averages 28 days.  The only rainfall during the July-August period came during a one-hour rainshower on August 11.  After that, there was no measurable rainfall for the remainder of the month.


Daily & Cumulative Rainfall in Victoria, Summer 2018
The chart below compares the rainfall amounts in Victoria this summer with other locations in the regions.  As is typically the case, Victoria Gonzales had the lowest amount, with a total of 20.6 mm.  Victoria Airport had 27.4 mm of rain throughout the summer, about one third more than Victoria Gonzales.  Although this summer was also drier than normal in Vancouver, it still had about 3 times as much rainfall as Victoria (67 mm at Vancouver Harbour), which is pretty typical.  Rainfall in Seattle was also well below average this summer, and it received just slightly more rain (22.4 mm) than Victoria.   June accounted for the majority of rainfall this summer in all locations.  If you look at just July and August, the difference between Victoria and the other locations is even more stark.  Victoria Gonzales received 2 mm of rain during July and August versus about 6 mm in Seattle and 20 mm in Vancouver.  


Summer 2018 rainfall by month

The mean temperature for June, July, and August at Victoria Gonzales was 16.0 degrees, warmer than the 30-year average of 15.6.  Summer 2018 was tied for the 13th warmest in 105 years of record-keeping at Gonzales, so only about 1 in 8 summers have been warmer.  (Summer 2015 was the warmest on record, at 16.9 degrees.)  June's mean temperature of 14.5 degrees was right on the average.  July's mean of 17.1 degrees was a full degree above the average while August's mean of 16.5 degrees was just 0.2 degrees above average.  This summer, and especially this July, was considered a hot one in Victoria.  However, Victoria Gonzales didn't really experience any extremely hot temperatures.  The warmest maximum during the summer was just 27.2 degrees on August 14 (and the warmest Victoria Gonzales reached in July was just 26.4 degrees).  In fact, the hottest day of the summer this year (27.2) was the 10th coolest on record at Victoria Gonzales, and the coolest since 1982 (that's 36 years).  Typically, the warmest day of the summer at Victoria Gonzales is around 30 degrees.

The chart below shows the daily maximum and minimum temperatures at Victoria Gonzales during summer 2018, compared with the 30-year averages.  While daytime highs during the first half of June were cooler than average, the rest of the summer was mostly above average, though as noted above, there were no extremely warm temperatures.  Overnight lows were quite consistently close to average or slightly warmer than average.


Average daily max & min temperatures in Victoria, Summer 2018

Saturday, August 4, 2018

A warm and dry July in Victoria

July is typically the driest month of the year in Victoria, and this year it was particularly dry: there was no  measurable rainfall recorded at Victoria Gonzales during the entire month.  This is actually the 6th rain-free July at Victoria Gonzales, the others being 1914, 1922, 1926, 1958, and 1984.  There have also been another 6 Julys with less than 1 mm of rain recorded.

It was a dry month throughout the region, but most other locations outside Victoria recorded at least some rain, including the University of Victoria (0.9 mm), the Victoria Airport (2.2 mm), Vancouver Airport (5.4 mm), Vancouver Harbour (14.2 mm), and Seattle (1.3 mm).

July was also warmer than average in Victoria.  The mean temperature of 17.1 was more than a full degree above the 30-year average of 16.0, and it tied for the 7th warmest July at Victoria Gonzales.    The warmest July was 17.8 degrees in 2004.  The average daily maximum/minimum temperatures for July 2018 were 21.8/12.4 compared with the normal 20.4/11.7.  Although there was a lot of talk about an extended heat wave in the region this July, it never really got that hot along the water in Victoria.  The warmest temperature recorded at Victoria Gonzales for the month was 26.4 degrees, which is below the average monthly maximum temperature for July of 27.9 degrees.

Temperatures were considerably warmer in other parts of the region.  The mean temperature at the Victoria Airport was 18.3 degrees ( with a daily max/min of 24.3/12.4).  At the University of Victoria, the July mean temperature was 18.6 (25.5/11.7).  The table below shows the average daily maximum temperature for July 2018 at a number of locations around the region.  The official Environment Canada weather stations are bolded; the other stations are from the Victoria Schoolnet weather stations.  Average temperatures ranged from a cool 19 degrees at Trial Island lightstation (just off south Oak Bay) to a toasty 27.5 degrees at Butchart Gardens, near Brentwood Bay in Central Saanich. 

Average Daily Maximum Temperature - July 2018


Friday, August 3, 2018

Canadian Climate Comparison: What are the sunniest cities in Canada?

After comparing temperature and precipitation in the 41 largest urban areas in Canada (those with at least 100,000 population), we'll now look at sunshine.

The chart below ranks the average annual hours of sunshine in the 41 largest cities in Canada, from highest to lowest.  The 7 sunniest cities are all located in the southern Prairies, but with 2,198 annual hours, Victoria comes in a very respectable 8th place out of the 41 cities.  Put another way, Victoria gets more sunshine than 82% of Canada's urban population.

Victoria is by far the sunniest of the British Columbia cities included in the ranking: Kamloops, the next sunniest B.C. city, ranks 16th out of 41, while Kelowna in the "sunny Okanagan" ranks 28th.  The other coastal B.C. cities are all near the bottom of the ranking, taking up the 37th through 40th spots.  Only St. John's Newfoundland ranks lower in terms of annual sunshine.  The difference between Victoria and the other coastal B.C. cities is striking, and again points to the importance of the Olympic Mountain rainshadow in impacting Victoria's climate.

Average Annual Sunshine Hours for Urban Areas in Canada
As with precipitation, seasonal variations are also important in comparing Canadian cities.  The chart below ranks summer (June to August) sunshine hours in Canadian cities.  Victoria moves up to rank as the third sunniest summer, after Lethbridge and Regina.  Victoria has sunnier summers than 97% of Canada's urban population.  Though well behind Victoria, the other coastal B.C. cities fare better on summer sunshine than they do on annual sunshine, with Nanaimo in 24th and Vancouver in 29th.  Cities in Atlantic Canada hold the bottom 4 spots.

Average Summer Sunshine Hours for Urban Areas in Canada

In addition to having the 3rd sunniest summers among Canadian cities, Victoria ranks as the 8th sunniest for both springs and falls.  Winter, however, is quite different.  The chart below ranks winter (December to February) sunshine hours for Canadian cities.  The top 10 sunniest winter cities include a mix of cities in the Prairies, as well as New Brunswick and Quebec.  Victoria ranks a lowly 33rd, although that is still better than any of the other B.C. cities, which fill the bottom 6 spots.  It might surprise some that Kelowna - in the "sunny Okanagan" - has the cloudiest winters among Canadian cities, but B.C.'s Interior valleys are very prone to low cloud and fog in the winter.   

Average Winter Sunshine Hours for Urban Areas in Canada


Sunday, July 29, 2018

Canadian Climate Comparison: which cities get the most and least rainfall?

In the last post, we compared temperatures in the 41 largest urban areas in Canada (those with 100,000 or more people).  In this post, we'll compare precipitation amounts.

The chart below compares average annual precipitation in the 41 largest cities in Canada, ranked from lowest to highest.  The driest city is Kamloops, in the B.C. Interior, with an average of 287 mm annually.  The remaining top 10 driest urban areas in Canada are mostly in the Prairies, along with two more B.C. cities: Kelowna and Victoria.  People are often surprised that Victoria ranks so high among the driest cities in Canada.  Putting this another way, Victoria gets less annual precipitation than nearly 82% of Canada's urban population.  Victoria's low rainfall is thanks to rainshadowing, from both the mountains on Vancouver Island and from the Olympic Mountains in Washington State.  The wettest of the 41 cities is Chilliwack, followed by Vancouver and Abbotsford.  St. John's and Halifax round out the top 5 wettest cities in Canada.  It's striking that cities in Coastal B.C. occupy the top 3 spots for the wettest urban areas in Canada, while nearby Victoria ranks as the 10th driest out of the 41 cities.

Average Annual Precipitation for Urban Areas in Canada

Seasonal variations in precipitation are also important when comparing Canadian cities.  The chart below ranks summer (June to August) precipitation for Canada's cities.  With just 52 mm of rainfall, Victoria is by far the driest urban area in Canada during the summer.  The next driest city - Kamloops - gets nearly 70% more summer rainfall than Victoria, most cities outside of B.C. - such as Calgary, Toronto, or Montreal - get 4 to 5 times as much summer rainfall as Victoria.  The top 6 driest summer cities are all in B.C. - 4 on the coast and 2 in the Interior.  This really shows the impact of the seasonal variation of precipitation in Coastal B.C.  While we just saw that Vancouver ranks as the second wettest city in terms of total annual precipitation, it is the 5th driest city in Canada in terms of summer precipitation.  The wettest summers tend to be in Atlantic Canada and Quebec.

Average Summer Precipitation for Urban Areas in Canada

Victoria also has relatively dry springs - ranking as the 9th driest among Canadian cities.  Fall precipitation in Victoria is closer to the average, with the city ranking as the 17th driest out of 41 cities.  Winter is a different story.  The chart below ranks winter (December to February) precipitation for Canadian cities.  Saskatoon has the driest winters among Canadian cities, with just 37 mm of precipitation.  The top 10 driest winter cities are all located in the Prairies, the B.C. Interior, or Northwestern Ontario.  Victoria ranks as the 31st driest winter city (or the 11th wettest), with 264 mm of precipitation.  The top 5 wettest winter cities are exactly the same as the top 5 wettest cities overall, with Chilliwack in first place with a whopping 659 mm.

Average Winter Precipitation for Urban Areas in Canada

Friday, July 27, 2018

Canadian climate comparison: what is the mildest city in Canada?

This is the first in a series of posts comparing various aspects of climate for locations across Canada, in order to see how Victoria compares.

There are a lot of locations in Canada, so I am focusing on urban areas, where the majority of Canada's populations lives.  I collected climate data for urban areas (Census Metropolitan Areas) with a population of at least 100,000 according to the 2016 Census.  There were 41 such urban areas in 2016, accounting for about 73% of Canada's total population.

This first post is comparing temperatures across Canada.  We'll start by looking at the mean annual temperature for each location.  The chart below ranks Canada's urban areas by mean annual temperature.  Not surprisingly, Victoria ranks first, with a mean annual temperature of 10.6 degrees.  It is followed by Vancouver.  The top 10 includes 5 cities in coastal B.C., 4 cities in Southern Ontario, as well as Kamloops in the B.C. Interior.  The coldest cities are generally those in the Prairies.

Mean Annual Temperature for Urban Areas in Canada

Of course, these annual comparisons mask a lot of seasonal variations among the different cities, so let's look at some of the seasonal rankings.

The chart below compares the mean winter temperature for urban areas in Canada.  This is the mean temperature for December, January and February - which is meteorological winter.  In this case, the coastal B.C. cities really stand out: they are significantly milder than any other locations in Canada.  Victoria's mean winter temperature of 5.8 degrees - the mildest in Canada - is more than 8 degrees warmer than the mildest Canadian city east of the coastal mountains (Chatham, Ontario, with a mean winter temperature of -2.5 degrees).  Even the coolest coastal B.C. city - Chilliwack - is nearly 6 degrees warmer than the warmest city in the rest of Canada.  The top 10 mildest winter cities in Canada include the coastal B.C. cities making up the top 5 spots, as well as two cities in the B.C. Interior, 2 cities in Southern Ontario, and Halifax.  Again, the coldest cities tend to be in the Prairies.

Mean Winter Temperature for Urban Areas in Canada

Victoria also ranks as the warmest Canadian City during meteorological spring (March to May), and the third warmest city during fall (September to November), after Chatham and Windsor in southwestern Ontario.  However, the situation is very different during the summer (June to August), as can be seen in the chart below.  Victoria is the fourth coolest urban area in Canada during the summer: only Calgary, Red Deer, and St. John's are cooler on average.  The top 10 warmest summer cities in Canada include 8 Southern Ontario cities, along with Montreal and Kamloops.

Mean Summer Temperature for Urban Areas in Canada

Thursday, July 26, 2018

A brief look at June 2018

I'm a little behind on the blog, so I'm just going to take a brief look at June 2018. 

June was actually pretty close to average this year.  The rainfall at Victoria Gonzales was 18.6 mm, close the the 30-year average of 20.0 mm.  There was measurable precipitation on 6 days in June, again pretty close to the average of 6.8 days. 

While rainfall was very close to average at Victoria Gonzales, other locations around the region recorded somewhat lower than average rainfall amounts (though they still all received more rainfall than Victoria Gonzales).  The Victoria Airport received 23.6 mm of rain in June, below its 30-year average of 30.6 mm.  Vancouver Airport received 38.8 mm, while Vancouver Harbour received 47.8 mm - both below the 30-year average of 54 mm and 70 mm respectively. 

The mean temperature in June was 14.5 degrees, which is right on the 30-year average.  The mean daily maximum for the month was 18.4 degrees, just below the average of 18.5, while the mean daily minimum for the month was 10.6, just above the average of 10.4 degrees.  The warmest temperature of the month was 25.4 degrees, while the coolest temperature was 8.2 degrees.  Again, these are quite typical values for June.

Tuesday, June 5, 2018

A look at Spring 2018

Meteorological Spring (March to May) is now over, so it's time to look back at the spring of 2018.

Overall, this spring was slightly warmer than normal, with a mean temperature of 10.4 degrees versus the 30-year average of 10.0 degrees.  This spring was still cooler than spring 2014, 2015, or 2016.  Spring 2016 was the warmest on record in Victoria, with a mean temperature of 11.9 degrees.

The chart below compares daily maximum and minimum temperatures with the long-term averages for Victoria Gonzales.  Generally, temperatures have been close to average, expect for a spike in late April and again from May 5-15.  March was slightly below average temperatures, April was right on average for the month, and May was above average.

Daily Max & Min Temperatures at Victoria Gonzales, Spring 2018
Spring 2018 precipitation was a bit below average.  Both March and May experienced well below average rainfall, but April was much wetter than average.  The chart below shows daily and cumulative rainfall for March to May 2018 at Victoria Gonzales.  You can clearly see the very wet spell in April, especially from about April 4 to 16.  This less than two week period accounted for nearly two thirds of all the rain during Spring 2018.


Daily and Cumulative Rainfall at Victoria Gonzales, Spring 2018

A warm and dry May in Victoria

May 2018 was warm and dry in Victoria, but there were no monthly records set.

The mean temperature for May 2018 was 13.6 degrees at Victoria Gonzales, significantly warmer than the 30-year average of 12.4.  That was tied for the 8th warmest May out of 105 years on record at Victoria Gonzales.  In other words, May was warmer than average, but not record-breaking.  The warmest May at Gonzales was 14.2 degrees in 2005.

The average daily high and low temperatures for May 2018 were 17.5 degrees and 9.8 degrees, in both cases more than one degree above the normals of 16.3 and 8.4 degrees.  The warmest temperature of the month was 25.2 degrees on May 13th.  The coolest temperature was 7.5 degrees on May 2nd.

The chart below shows the daily maximum and minimum temperatures this May compared with the long term averages.  Temperatures were above normal for most of the month, but especially from about May 5-15.

Daily Max & Min Temperatures at Victoria Gonzales, May 2018


Following a wet April, May was dry in Victoria with just 8.8 mm of rainfall at Victoria Gonzales, about one third of the 30-year average of 28 mm.  This was the 15th driest May on record at Victoria Gonzales (with records going back 105 years), so again, while it was drier than normal, it wasn't really too unusual.  The driest May on record in Victoria was 1.8 mm back in 2015.

Victoria's entire May rainfall in 2018 all came on one day, May 10.  On average, Victoria gets 9 days with measurable rainfall in May, so having just one day with rainfall is well below the average.  The chart below shows the daily and cumulative precipitation in Victoria this May, compared with the average cumulative precipitation.  Clearly, rainfall was well below normal.  There was no measurable rainfall during the last 21 days of the month.

Daily and Cumulative Rainfall at Victoria Gonzales, May 2018


While Victoria typically gets less rainfall than other locations in the region, that was not the cast this past May.  While Victoria Gonzales received 8.8 mm of rainfall in May, there was only 3.4 mm of rain at the Victoria Airport.  Typically, the Airport receives about one third more rainfall than Victoria Gonzales in May.  The comparison with Vancouver was even more unusual this year.  Normally, Vancouver receives about three times as much rain than Victoria in May (85 mm versus 28 mm), but in 2018 Vancouver's May rainfall was just 1.6 mm.

Wednesday, May 2, 2018

A wet April in Victoria

As was the case in March, April in Victoria had close to normal temperatures, but while March 2018 was much drier than normal, April 2018 was much wetter than normal.

The mean temperature for April 2018 was 9.9 degrees at Victoria Gonzales, right on the 30-year average.  The average daily high temperature of 12.9 degrees this year was half a degree below the normal of 13.4, while the average daily low temperature of 6.8 degrees was half a degree above the normal of 6.3 degrees.  The warmest temperature of the month was 24.9 degrees on April 26th.  That's the fourth warmest monthly maximum temperature ever recorded at Victoria Gonzales, with the warmest being 27.0 degrees in April 1998.  Victoria Gonzales averages about 1 day in April with maximum temperatures above 20 degrees; this year there were 3 days.  The coldest temperature was 2.5 degrees on April 2nd, which is a fairly typical monthly minimum for April.

The chart below shows the daily maximum and minimum temperatures this April compared with the long term averages.  Generally, temperatures have fluctuated around the averages, although you can see a period of below average temperatures mid-month, followed by a mini-heatwave that occurred April 23-26.

Daily Max & Min Temperatures in Victoria, April 2018


While temperatures were close to normal, precipitation was well above normal, with 62 mm of rainfall at Victoria Gonzales in April, nearly double the 30-year average of 33 mm.  This was the ninth wettest April on record at Victoria Gonzales (with records going back 105 years).

The chart below shows the daily and cumulative precipitation in Victoria this April, compared with the average cumulative precipitation.  Clearly, rainfall was well above normal, particularly in the first half of the month.  There was measurable precipitation (more than 0.2 mm) on 15 days this April, compared with the normal of 10 days.  The wettest days were the 4th (when 13.2 mm of rain fell) and the 16th (12.2 mm).

Daily & Cumulative Rainfall in Victoria, April 2018


As is typical, other locations in the region were even wetter than Victoria Gonzales in April.  The Victoria Airport recorded 98 mm of rain in April, while Nanaimo recorded 113 mm (about double Victoria).   Vancouver Harbour recorded 179 mm of rain in April - nearly three times as much rain as Victoria, which is fairly typical.  Seattle recorded 145 mm of rain in April.


Thursday, April 5, 2018

Winter in April

Despite all the flowers blossoming around town, yesterday was a very winter-like day in Victoria.  The high yesterday was just 6.7 degrees.  That's more than 5 degrees below the normal high for April 4 of 12.2 degrees.  That's even below the average 7.2 degree high for December, Victoria's coldest month.  It was definitely chilly!  There have only been two April days in the past 50 years that were colder than yesterday.

It was also quite wet, with 13.2 mm of rain.  That's about 40% of the normal rainfall for the entire month of April.  It seemed especially rainy after the dry March that we just experienced.  In fact, the 13.2 mm of rain yesterday was almost as much as the 13.6 mm recorded in the entire month of March this year.

The normal average high temperature for April is 13.4 degrees, while average rainfall is 33 mm with measurable precipitation on 12 days.  Rain is recorded at Victoria Gonzales 11% of the time during April, while sunshine is recorded 52% of daylight hours.  Hopefully, we'll get back into our more typical warmer, drier and sunnier April weather soon!

Sunday, April 1, 2018

March 2018 - typical temperatures but very dry

In terms of temperature, March was pretty close to normal in Victoria.  The mean temperature for the month was 7.6 degrees at Victoria Gonzales, just slightly below the 30-year average of 7.8 degrees.  The average daily high temperature of 10.8 degrees this year was actually right on normal, but the average daily low temperature of 4.4 degrees was below the normal of 4.8 degrees.  The warmest temperature of the month was 16.4 degrees on March 12th, and the coldest temperature was 2.0 degrees on March 25th.  On average, about one in every six years it drops below freezing in March at Victoria Gonzales, but this year was not one of those years.  (The last time it was below freezing in March at Victoria Gonzales was March 2009.

The chart below shows the daily maximum and minimum temperatures this March compared with the long term averages.  Generally, temperatures have fluctuated around the averages. 

Daily Max & Min temperatures in Victoria, March 2018


While temperatures were close to normal, precipitation was well below normal, with just 13.6 mm of rainfall at Victoria Gonzales in March, only 27% of the 30-year average of 50 mm.  In fact, this was the fourth driest March on record at Victoria Gonzales (with records going back 105 years). 

The chart below shows the daily and cumulative precipitation in Victoria this March, compared with the average cumulative precipitation.  Clearly, rainfall was well below normal.  There was measurable precipitation (more than 0.2 mm) on 8 days this March, compared with the normal of 14 days.

Daily & cumulative precipitation in Victoria, March 2018
Other locations in the region weren't nearly as dry as Victoria.  The Victoria Airport, which normally gets about 55-60% more March precipitation than Gonzales, had more than twice as much rain as Gonzales this year: 30.7 mm (though this was still less than half the normal amount at the Airport).   Other locations were even wetter, with 51 mm at Nanaimo, 62 mm at Seattle, and a whopping 142 mm at Vancouver Harbour.  Vancouver normally gets about 3 times as much rainfall as Victoria in March, but this year it recorded 10 times as much!  Below is a chart comparing March precipitation at several locations in the region.


Finally, there was no snow in Victoria in March.  This is not unusual.  The average March snowfall at Victoria Gonzales is just 1 cm, and there is no snow in March in Victoria more than 60% of the time.  The last time there was measurable snow in March in Victoria was 2009.

Saturday, March 24, 2018

A look at winter 2017/18 in Victoria

Meteorological winter (December to February) finished a few weeks ago.  So what was the winter of 2017/18 like in Victoria?  Unlike the very warm winters of 2014/15 and 2015/16, followed by the extremely cold winter of 2016/17, this past winter was closer to normal, though still a bit cooler and wetter than the 30-year average.

The mean temperature over the three month period was 5.4 degrees - cooler than the 30-year average of 5.8 degrees, but nothing too unusual.  This follows the extreme cases of 2014/15 (mean winter temperature of 7.6 degrees), 2015/16 (6.8 degrees), and 2016/17 (just 3.9 degrees).  The average daily max/min temperature this past winter was 7.4/3.3 (compared with the normal 7.9/3.6).  The warmest temperature was 12.8 on February 4th and the coldest was -2.2, also recorded in February, on the 21st.  There were 10 days when the temperature dropped below 0 (4 days in December, none in January, and 6 in February).  The 30-year average for Victoria Gonzales is 7.6 days with overnight temperatures dropping below freezing during the winter.

The chart below shows the daily maximum and minimum temperatures this winter, compared with the 30-year averages.  The first half of December was fairly mild, then it turned cold in late December.  January was generally quite mild, with temperatures just above normal.  February started out mild, then turned much colder towards the end of the month.

Daily Maximum & Minimum Temperatures, Winter 2017/18

This winter was also a little wetter than normal.  Total precipitation from December to February was 308 mm, compared with the 30-year average of 264 mm.  All three winter months were slightly  wetter than the winter normal.  The chart below shows the daily and cumulative precipitation this winter compared with the average.  Early December was dry, but rainfall totals caught up to normal when 37 mm of rain fell on December 19, the wettest day of the winter.  After that, cumulative precipitation stayed slightly above normal.

Daily & Cumulative Precipitation, Winter 2017/18

The 308 mm of precipitation recorded at Victoria Gonzales this winter compared with 399 mm at the Victoria Airport and 655 mm at Vancouver Harbour.

There was 11 cm snow this winter, a little more than half the 30-year average of 20 cm.  We had one snowfall in December (perfectly timed to fall overnight on Dec. 24-25, then all melted by Dec. 26), and one snowfall in February.

Monday, March 5, 2018

2017: A year in review

After two very warm years in 2015 and 2016, average temperatures in 2017 were close to the long term average: 10.5 degrees versus the 30-year average of 10.6 degrees.  The year started out cold, with January and February almost 2 degrees colder than average, and March  nearly 1 degree colder than average.  From April to July, temperatures were close to the average, then August through October was about 1 degree warmer than average.  The year ended with below average temperatures in December.

The warmest temperature of the year was 30.4 degrees on June 24, while the coldest temperature was -3.2 degrees on January 3.  There were 3 days in 2017 with a maximum temperature above 30 degrees, compared with the average of just 1 day.  Conversely, there were 18 days in 2017 with a minimum temperature below freezing, well above the average of 9.5 days.

The chart below compares the daily maximum and minimum temperatures for 2017 at Victoria Gonzales with the long term average temperatures.  You can see that the beginning and the end of the year were colder than average, while the middle part of the year experienced average to above average temperatures.

2017 daily maximum and minimum temperatures

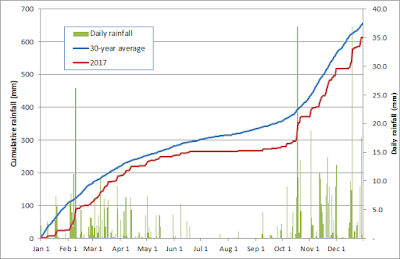
As was the case in 2016, precipitation was close to normal in 2017.  Victoria had 613 mm of precipitation in 2017, just slightly below the average of 641 mm.  The number of days with measurable rainfall was below average: 128 days in 2017 versus the average of 140 days.  There was actually a tie for the wettest day in 2017: both October 18 and December 19 received 37.0 mm of rain.

The chart below compares the daily and cumulative precipitation in 2017 with the average cumulative precipitation.  You can see that we stayed fairly close to the average throughout the year, following our typical pattern of wet winters and dry summers.  July and August are typically very dry in Victoria, and in 2017 they were especially dry, with just 0.8 mm in July and 1.4 mm in August.  The combined 2.2 mm of rain in July and August was the lowest ever recorded at Victoria Gonzales.  January was also a dry month in Victoria in 2017, with just 25.7 mm of rain, making it the 5th driest January on record at Victoria Gonzales.

2017 daily and cumulative precipitation

Victoria typically receives less rainfall than surrounding areas, and 2017 was no exception.  The chart below compares total annual precipitation for a number of cities in our region.  Compared with 613 mm  of precipitation at Victoria Gonzales, the Victoria Airport received 910 mm - 48% more than Victoria proper.  Nanaimo (1048 mm) received 70% more rain thanVictoria in 2017 while Vancouver (1568 mm) received more than 2.5 times as much rain.  Seattle (1216 mm) received twice as much rainfall asVictoria.