Sunday, March 5, 2017

Victoria's cold winter of 2016-17

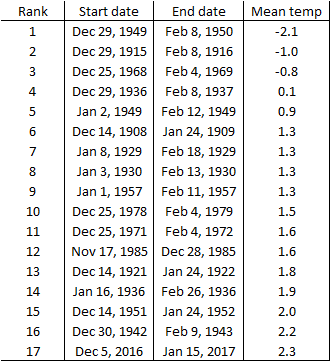
We've recently come to the end of meteorological winter (December 1 to February 28), and it was definitely an unusual winter in Victoria.  The biggest stand out was the temperature - this past winter was the coldest in 38 years in Victoria.  The last time we had a winter this cold was back in 1978-79.  Victoria has actually experienced 20 winters in the last 120 years that were at least this cold.  However, all of those winters were prior to 1980, so we're just not used to it  any more!

The mean temperature this past winter was 3.9 degrees, roughly 2 degrees below the 30-year average of 5.8 degrees.  The average daily maximum/minimum this winter was 6.1/1.6, again roughly 2 degrees below the normal winter daily max/min of 7.9/3.6. 

The chart below compares the daily maximum and minimum temperatures this winter with the 30-year average temperatures.  You can see that the temperatures were pretty consistently below average, with just a couple of brief spells of milder weather. 

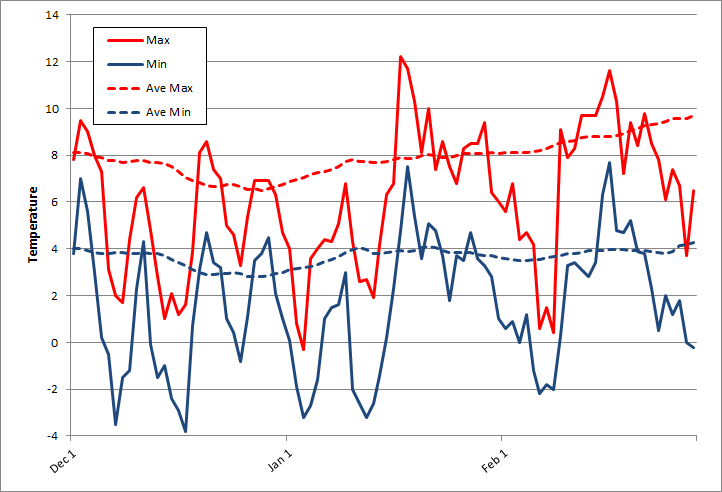
Daily maximum & minimum temperatures in Victoria, winter 2016-17


Victoria experienced 25 days when the temperature dropped below freezing this winter, compared with the average of 8.8 days.  Again, that’s the most days since the winter of 1978/79.  However, the record was 41 days in 1912/13.  While we had a lot of overnight lows below freezing, it never really got that cold in Victoria this winter.  The coldest temperature was -3.8 degrees on December 17.

Conversely, Victoria experienced daytime temperatures above 10 degrees on just 7 days this winter, compared with the average of 20 days.  Last winter (2015/16) there were 28 days above 10 degrees and the winter before that (2014/15) there were 42 such days - six times as many as this winter.  To put it another way, just 8% of winter days this year were above 10 degrees, compared with 47% of winter days in 2014/15.   

The colder weather was partly the result of a number of arctic outbreaks, bringing cold sunny weather to Victoria.  As a result, total precipitation for the winter was below normal: 222 mm versus the 30-year average of 264 mm.  The chart below compares the daily and cumulative precipitation at Victoria Gonzales this past winter with the 30-year normal precipitation.  While December was a bit wetter than normal, January was very dry and February was about average.  The highest daily rainfall was 26 mm on February 9.  Overall, there were 46 days with measurable precipitation this winter, which was right on the average.

Daily & cumulative precipitation in Victoria, winter 2016-17


As usual, Victoria was much drier than surrounding areas, as shown in the chart below.  Compared with Victoria Gonzales (222 mm), the Victoria Airport (315 mm) had 50% more precipitation, while Seattle (430 mm) and Vancouver (469 mm) both had about twice as much. 


Winter 2016/17 brought the first significant snowfall in 5 years to Victoria.  Not surprisingly, snowfall was above normal.  Total snowfall for the winter was 29 cm, almost double the 30-year average of 16 cm for December to February (total annual snowfall averages 20 cm in Victoria).  There was 8 cm of snow in December, just 1 cm of snow in January, and a whopping 20 cm in February (versus normal of 9 cm for December, 3.4 cm for January, and 3.6 cm for February). In terms of days with snow on the ground, Victoria got off not too badly (especially compared with Vancouver and up-Island): there were 5 days with at least 1 cm of snow on the ground this winter compared with the normal of 4.5 days during December to February.

Wednesday, February 1, 2017

A cold and dry January in Victoria

January was another cold month in Victoria, following a cold December, with continued “Arctic outbreaks” of cold dry air from the B.C. Interior, interspersed with periods of milder Pacific air.  The mean monthly temperature of 3.9 degrees was nearly a full two degrees below the 30-year average of 5.8 degrees.  In fact, January 2017 was the coldest January since 1993 - nearly 25 years ago.  The average daily max and min temperature in January was 6.2/1.5, compared with the normal of 7.7/3.8.  The warmest temperature during the month was 12.2 degrees on the 17th, while the coldest temperature was -3.2 degrees, recorded on both the 3rd and the 12th.  The daily maximum exceeded the monthly average of 7.6 degrees on only 10 days this January.  On the other hand, the overnight minimum was lower than the monthly average of 3.8 degrees on 25 days this January.  There were 9 days when overnight lows dropped below freezing, compared with the long term average of 2.9 days.

The chart below shows the daily maximum and minimum temperatures in Victoria this past month, compared with the average temperatures.  You can see that temperatures were below average during the first half of the month (with an average daily max/min of 3.6/-0.9).  The second half of January saw slightly above average temperatures ( average max/min of 8.5/3.9), except for a dip during the last few days of the month.

Daily Maximum and Minimum Temperatures, January 2017


While January 2017 was cold, the frequent Arctic outbreaks meant it was also dry.  There was only 24.7 mm of precipitation recorded at Victoria Gonzales in January.  This is about one quarter of the normal 104 mm, making this January the 5th driest in the past 100 years at Victoria Gonzales.  Victoria saw precipitation on just 8 days in January 2017, compared with the usual 17 days.  Two thirds of the month’s rainfall came in a short 3-day stretch from January 17 to 19.  Despite the cold, there wasn’t much snow in Victoria this January, just a 1 cm dusting on January 1st that melted away by noon.

The chart below shows daily and cumulative precipitation in Victoria this January, compared with the long-term average cumulative precipitation.  You can see that the amount is well below normal.

Daily and Cumulative Precipitation, January 2017


As I’ve mentioned many times on this blog, Victoria tends to get significantly less rainfall than surrounding areas, and this past month that trend was even more evident.  The chart below compares the total precipitation for January 2017 at Victoria Gonzales and a number of nearby locations.  The Victoria Airport, 30 kms to the north, had  more than twice as much precipitation as Victoria Gonzales.  Nanaimo had 3 times as much precipitation as Victoria, Seattle had more than 4 times as much, and Vancouver had more than 5 times as much.  In the winter time, the differences usually aren’t this great.  The Arctic outbreaks we had this month tended to push the jet stream further south, with lots of precipitation going into California.  As a result, Los Angeles, received  over 200 mm of rain - more than 8 times as much as Victoria.


Sunday, January 15, 2017

Victoria's Cold Snap of 2016-17

December and early January is the coldest time of the year in Victoria, but the past six weeks have been unusually cold this winter.  Since December 5, the average daily high temperature at Victoria Gonzales has been has been just 4.4 degrees (compared with the normal high of 7.3 for this period), while the average daily overnight low has been very chilly 0.2 degrees (compared with the normal overnight low of 3.4).  As a result, the overall mean temperature in Victoria over the past six weeks (December 5 to January 15) has been just 2.3 degrees - a full 3 degrees below the normal.  For Victoria, where temperatures tend not to deviate too much from the mean, that is a very significant deviation over such a long period of time.  In fact, we've just finished the coldest 6-week spell in Victoria in over 30 years.  The last time we had a six week stretch this cold was back in November-December 1985.

The chart below shows the daily mean temperatures at Victoria Gonzales over the past six weeks with the 30-year average temperatures for the same period.  You can see that, except for a few days in mid- and late-December, temperatures have generally been well below average.  However, there have been significant fluctuations, with a cyclical pattern of a few cold days followed by a short rebound to close to normal temperatures.

Daily mean temperatures for Victoria  in 2016-17 vs. 30-year average
During this cold snap, overnight temperatures dipped below freezing 21 times - half of the nights in the past six weeks.  Normally, Victoria Gonzales would see freezing temperatures an average of just 5 times during this period.  While we had a lot of days with frost, the temperatures really didn't get that cold during this cold snap - even by Victoria standards.  The coldest temperature recorded during the period was -3.8 degrees on December 17 (and there were only three other days when the temperature dropped below -3).  Victoria gets down to -3.8 most winters (16 of the past 30 winters, for example).  In fact, Victoria has dropped below -6 in 10 of the past 30 winters.

Daytime highs were also well below normal.  Victoria Gonzales even saw one day - January 3 - when the daytime high failed to reach the freezing mark (it was -0.3 degrees).

While it's been cold in Victoria, other locations around the region have been even colder than Victoria Gonzales' mean of 2.3 degrees.  Out at the Victoria Airport, the mean temperature was just 1.0 degrees during this period, and below-freezing temperatures were recorded on 34 nights.  In Vancouver, the mean temperature was a very cold -0.2 at the Airport, although it was a milder 1.7 degrees downtown at the Vancouver Harbour.  Vancouver Airport saw 34 days with overnight lows below freezing and three days when the daytime highs failed to reach the freezing mark.  In Seattle, the mean temperature was 1.9 degrees.   The table below summarizes the average temperatures during the cold snap.


As mentioned above, this is the coldest six week period we've had in Victoria in the past 30 years.  While there haven't been cold snaps like the one we've just experienced in the recent past, they did used to be more common in Victoria.  The table below the coldest six week periods recorded in Victoria over the past 100 years.  I have listed all the cold snaps that were colder than the one we've just experienced.  You can see that the 2016-17 cold snap was the 17th coldest six week period recorded at Victoria Gonzales over the past century.  While the average temperature of 2.3 degrees has seemed very cold, Victoria's coldest cold snap (in 1949-50) was a bone-chilling -2.1 degrees!  Victoria has experienced two other cold snaps when the mean temperature over a six week period has been below freezing (1915-16 and 1968-69).


Monday, January 2, 2017

Almost another record-breaking year in Victoria.

2015 was the warmest year ever recorded in Victoria.  For most of the past year, it looked like 2016 might be even warmer.  The mean temperature in Victoria for January to November 2016 was 12.2 degrees, compared with 12.1 degrees for the comparable period in 2015.   That makes January to November 2016 the warmest 11 month period on record in Victoria.  If Victoria had just experienced average temperatures in December, then 2016 would have set the new record for warmest year.  Instead, December turned out to be one of the coldest Decembers in the past 30 years.  As a result, 2016 ended up being tied with 2004 for the second warmest year on record in Victoria, with a mean temperature of 11.5 degrees (versus 11.7 degrees in 2015).

Victoria still experienced impressive warmth in 2016.  That mean temperature of 11.5 degrees is almost a full degree above the 30-year average of 10.6 degrees.  It's also pretty amazing that we followed up the warmest year on record in 2015, with the second warmest year on record in 2015.  in addition, 10 of the 12 months in 2016 were warmer than normal, and we also beat a couple of monthly records: in 2016 we had both the warmest April on record and the warmest November on record.

The chart below compares the daily maximum and minimum temperatures for 2016 at Victoria Gonzales with the long term average temperatures.  You can see that for most of the year, we were well above the average.  Only in December did temperatures fall below the average for a significant period.


Daily max & min temperatures in Victoria, 2016

While temperatures were much warmer than average in 2016, precipitation ended up being much closer to normal.  Victoria had 623 mm of precipitation in 2016, just slightly below the average of 641 mm.  While the amount of precipitation was below average, the number of days with measurable rainfall was actually above average: 153 days in 2016 versus the average of 140 days.  The wettest day - by far - was February 15, when Victoria received a deluge of 61.6 mm of rain.  That's nearly 10% of our annual rainfall in one day.

The chart below compares the daily and cumulative precipitation in 2016 with the average cumulative precipitation.  You can see that we stayed fairly close to the average throughout the year, following our typical pattern of wet winters and dry summers.

Daily and cumulative precipitation in Victoria, 2016

Victoria typically receives less rainfall than surrounding areas, and in 2016 this pattern was even more pronounced than usual.  The chart below compares total annual precipitation for a number of cities in our region.  Compared with 623 mm  of precipitation at Victoria Gonzales, the Victoria Airport received 1006 mm - 60% more than Victoria proper.  Nanaimo (1370 mm) received more than twice as much rain as Victoria in 2016 while Vancouver (1618 mm) received more than 2.5 times as much rain.  Seattle (1148 mm) received more than 80% more rainfall than Victoria.  While Victoria was received slightly below average precipitation in 2016, all these other cities were wetter than average this past year.


A Cold December in Victoria

Since the beginning of 2014, has had an almost continual string of above average monthly temperatures.  Through November 2016, 31 of the previous 35 months were warmer than the long-term average, and of the four months that were cooler, three were only slightly below the average.  December 2016 was much colder than normal in Victoria, with a mean temperature of just 3.3 degrees - a full two degrees colder than the average of 5.3 degrees.  That made it the third coldest December in Victoria in the last 30 years. This past month was also the coldest of any month since 2008.  There were 11 days when the overnight low fell below freezing, compared with the normal of 2.9 days.  The coldest temperature of the month was -3.8 degrees on December 17, while the warmest temperature was 9.5 degrees on December 2.

The chart below compares this December's maximum and minimum temperatures at Victoria Gonzales with the 30-year average.  You can see that except for a handful of days, temperatures were well below normal for much of the month.  On several days, the daily maximums were below the normal minimums for that day.

Daily Max & Min Temperatures in Victoria, December 2016

As mentioned in the previous blog, snow also returned to Victoria in December, for the first time in nearly five years.  In total, there was 8 cm of snow during the month, with most of that falling on December 9.  There was one day during the month with significant (more than 2 cm) of snow on the ground - again on December 9.  Perhaps surprisingly after the snow-free weather we've experienced over the past several years, this December's snowfall was actually slightly below the 30-year average for December of 9 cm.  However, the average snowfall in December is skewed by a small number of large snowfalls - particularly the huge dump (over 100 cm) of December 1996.  If you don't count that one year, average December snowfall would drop to 5.5 cm.

December was wetter than average, with 120 mm of precipitation, compared with the average of 95 mm.  There were 21 days with measurable precipitation during the month, compared with the December average of 18 days.  The chart below compares daily and cumulative precipitation in Victoria during December 2016 with the 30-year average cumulative precipitation.  You can see that we ended the month with about 25% more precipitation than average.

Daily and Cumulative Precipitation in Victoria, December 2016