The warmest temperature of the year was 30.4 degrees on June 24, while the coldest temperature was -3.2 degrees on January 3. There were 3 days in 2017 with a maximum temperature above 30 degrees, compared with the average of just 1 day. Conversely, there were 18 days in 2017 with a minimum temperature below freezing, well above the average of 9.5 days.
The chart below compares the daily maximum and minimum temperatures for 2017 at Victoria Gonzales with the long term average temperatures. You can see that the beginning and the end of the year were colder than average, while the middle part of the year experienced average to above average temperatures.
 |
| 2017 daily maximum and minimum temperatures |
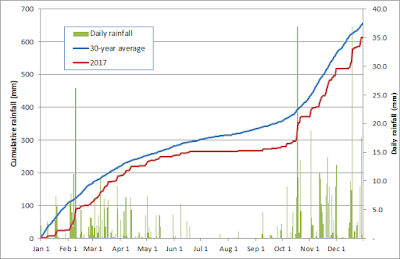
As was the case in 2016, precipitation was close to normal in 2017. Victoria had 613 mm of precipitation in 2017, just slightly below the average of 641 mm. The number of days with measurable rainfall was below average: 128 days in 2017 versus the average of 140 days. There was actually a tie for the wettest day in 2017: both October 18 and December 19 received 37.0 mm of rain.
The chart below compares the daily and cumulative precipitation in 2017 with the average cumulative precipitation. You can see that we stayed fairly close to the average throughout the year, following our typical pattern of wet winters and dry summers. July and August are typically very dry in Victoria, and in 2017 they were especially dry, with just 0.8 mm in July and 1.4 mm in August. The combined 2.2 mm of rain in July and August was the lowest ever recorded at Victoria Gonzales. January was also a dry month in Victoria in 2017, with just 25.7 mm of rain, making it the 5th driest January on record at Victoria Gonzales.
 |
| 2017 daily and cumulative precipitation |

No comments:
Post a Comment