Friday, October 21, 2022

An extraordinary drought

 Victoria is known for its summer droughts.  It is the driest major city in Canada - by far - during the summer months, with an average of 47 mm of rain during June to August combined.  It is also common to get long stretches with little or no rainfall during the summer.  On average, Victoria gets 31 consecutive days with no measurable rainfall each summer, and 42 consecutive days with less than 1 mm of rainfall.

However, the past three months have really been extraordinary.  From July 19 to October 20 - a period of 94 days - there have only been 3 days each with just a barely measurable 0.2 mm of rain (August 10, September 4, and September 28) at Victoria Gonzales.  That's a total of just 0.6 mm of rain in the past 3 months!  The nearby weather station at the University of Victoria has been even drier, with just 0.4 mm of rain over the same period.

This has been the driest 90-day period ever recorded at Victoria Gonzales, as shown in the chart below, easily beating the old record of 2.8 mm, from May 25 to August 22, 1951.  Note that most of these record dry periods tend to be centered on July and August, the two driest months in Victoria.  However, 3 of the 11 driest periods, include this year's, have extended into mid-October.


This record-breaking drought has not just impacted Victoria; it has affected all of southwestern B.C.  The chart below shows the total rainfall for various locations in southern B.C. over the past 3 months. As is often the case, Victoria has been the driest location, but most locations have been extraordinarily dry.  Keep in mind, that normal rainfall during this period is 91 mm at Victoria Gonzales and 231 mm at Vancouver Harbour.  


Not only has this period been the driest 3-month period ever recorded in Victoria (with 120 years of record-keeping at Victoria Gonzales), but it is also likely the driest 3-month period ever recorded in any major Canadian city.  The driest 3-month period ever recorded for some other Canadian cities includes 1.3 mm for Edmonton, 2.9 mm for Calgary, 6.1 mm for Vancouver Airport, and 37.9 mm for Toronto

In addition to being dry, it has also been a very warm 3 months.  The chart below shows the daily maximum and minimum temperatures at Victoria Gonzales during the drought period (July 19 to October 19), compared with the 30-year average.  With just a few exceptions, temperatures have been above normal.  The average daily maximum temperature for the period was 21.3 C -  nearly 3 degrees above the historical average of 18.4 C.  In addition, the average daily maximum temperature for the period in 2022 (21.3 C) is more than 1 degree warmer than the previous highest average maximum of 20.1 C for the same period in 1998.

Victoria Gonzales Daily Max & Min vs. normal


Sunday, September 18, 2022

Summer 2022 was warmer and slightly wetter than normal

 Meteorological summer consists of June, July, and August.  Summer 2022 started out wetter than normal, with close to normal temperatures in June and July. This was followed by a much warmer and drier than normal August.  Overall, the summer was warmer and about 10% wetter than normal this year in Victoria.  

The mean temperature this past summer at Victoria Gonzales was 16.3 degrees, which is 0.5 degrees above the 30-year average.  Summer 2022 was tied for the 8th warmest in Victoria since record-keeping began at Gonzales Observatory in 1914.  While June and July were just slightly above normal, August was the warmest on record in Victoria: 1.3 degrees above normal.  

The average daily high temperature this summer was 20.5 C (versus the normal of 20.0 C) while the average daily minimum was 12.0 C (normal 11.5 C).   

The chart below shows the daily maximum and minimum temperatures at Victoria Gonzales during summer 2022, compared with the 30-year averages.  The warmest temperature of the summer was 30.9 C on June 26th.  Victoria had one other day above 30 C, when it hit 30.2 C on August 30.  In between, there were several short mini-heatwaves, when the temperature rose above 25 C.  Victoria had 15 days with temperatures exceeding 25 C this summer, more than double the long term average of 6.8 days.  

Minimum overnight temperatures were generally have normal during summer 2022, especially in August. The coolest temperature during the summer was 8.8 C on June 15th.


Daily Max & Min temperatures, summer 2022


Victoria received 51.8 mm of rain from June to August, about 10% more than its normal summer rainfall of 47 mm. All the rain fell during the first half of summer: there was no measurable rainfall after July 18.  There was 34.2 mm of rain in June (89% above normal), 17.4 mm in July (44% above normal), and only 0.2 mm of rain in August.

Victoria had 13 days with measurable rainfall this summer, just less than the normal 14.8 days.  There were 8 days with measurable rain (>0.2 mm) in June, 5 in July, and none in August.  


The chart below shows daily precipitation during summer 2022, and compares the cumulative precipitation with the 30-year average.   June was very wet, with the summer's wettest day occuring on June 9th, with 19.2 mm of rain.  In fact, this was the wettest summer day at Victoria Gonzales since 2005.  July 3rd was also a wet day, with 12.8 mm of rain.  Those two days accounted for more than 60% of the summer's rainfall.

Daily & Cumulative Rainfall in Victoria, summer 2022


The chart below compares the rainfall amounts in Victoria this summer with other locations in the region.  As is typically the case, Victoria Gonzales had the lowest amount, with a total of 52 mm.  The Victoria Airport received 68 mm.  Vancouver received 103 mm - about twice as much as Victoria (Vancouver typically receives about 3 times as much rain in the summer as Victoria).  Seattle received 76 mm.    

Regional Comparison of Summer 2022 Rainfall

Summer 2022 slightly less sunny than normal.  June and July were both cloudier than normal, while August was sunnier than normal.  

The table below shows the number of mostly sunny days (>80% of possible sunshine), partly cloudy days (20-80% of possible sunshine), and mostly cloudy days (<20% of possible sunshine).  There were more mostly sunny days than normal (51 in 2022 compared with the normal of 45 days).  However, there were also more mostly cloudy days than normal (14 days compared with the normal of 12).  More than half of the summer's mostly cloudy days were in June.


Wednesday, June 8, 2022

Spring 2022: cooler and a bit wetter than normal

Meteorological spring consists of March, April, and May.  Thanks to a very chilly April and May, Spring 2022 was the coolest spring in Victoria since 2011.  Spring 2022 was also a bit wetter than average, especially during April.

The mean temperature this past spring at Victoria Gonzales was 9.0 degrees (ave. high 11.9 & ave. low 6.0), which is 1.1 degrees below the 30-year average of 10.1 C.  March was 0.2 degrees warmer than normal, but April and May were both 1.8 degrees cooler than normal.   Both April and May were the 2nd coldest in the past 30 years, with only 2011 being colder.     

The chart below shows the daily maximum and minimum temperatures at Victoria Gonzales during spring 2022, compared with the 30-year averages.  Temperatures were fairly normal until early April, but the second half of spring saw temperatures that were consistently lower than normal.  The highest temperature during the spring 2022 was 17.3 C on April 7, whereas the average warmest spring day at Victoria Gonzales is 25 C.  Victoria Gonzales normally sees 5.2 days during spring with temps above 20 C, and 0.8 days with temps above 25C.  The warmest temperature in May this year was just 16.6 C - the coldest May maximum ever recorded at Victoria Gonzales.


There were no days during Spring 2022 when the overnight low fell below freezing.  On average, Victoria sees just 0.6 days each spring with a low temperature below 0.  The coldest temperature of the spring was April 12th when the temperature dropped to 0.3 degrees.  


Daily Max & Min Temps in Victoria, Spring 2022


Victoria received 147 mm of precipitation during the March to May period.  That's about 27% more than the 30-year average spring precipitation of 115 mm.  March saw 60 mm of rain -9% above normal, April saw 53 mm of rain -  just 55% above normal, and May saw 34 mm - 30% above normal rainfall.  

Spring 2022 also saw more days with measurable rainfall than the average: 42 days compared with the average of 33.6.  There were 15 days in March, 15 days in April, and 12 days in May with measurable rainfall.  


The chart below shows daily precipitation during spring 2022, and compares the cumulative precipitation with the 30-year average.   Cumulative rainfall went above average in mid-March, and stayed above average for the rest of the spring.  The two wettest days of spring 2022 were March 17th and April 4th, each with 21 mm.

Daily & Cumulative Rainfall, Spring 2022


The chart below compares the precipitation amounts in Victoria this spring with other locations in the region.  Victoria Gonzales typically receives the lowest amount of rainfall in the region, and spring 2022 was no exception.  Victoria Gonzales received 147 mm (27% above normal) while the Victoria Airport received 220 mm (33% above normal).  Vancouver Harbour received 406 mm of rain during spring 2022 (18% above normal, and nearly 3 times as much as Victoria).  Seattle received 250 mm, which was closer to its normal of 234 mm, but still 70% more than Victoria.


Spring rainfall in the region, 2022


Wednesday, March 2, 2022

The cold winter of 2021-22 in Victoria

Meteorological winter is from December 1 to February 28.  Winter 2021-22 in Victoria was much colder than average.  It was also rainier and much snowier than average.  

This past winter was the coldest in the past 5 years, and the 4th coldest in the past 30 years.  The mean temperature at Victoria Gonzales was 4.6 degrees, which is 1.2 degrees colder than the 30-year average of 5.8.  The average daily maximum for winter 2021-22 was 6.7 degrees , while the average daily minimum was 2.5, both of which were 1.2 degrees colder than the 30-year averages of 7.9 max and 3.7 min.  December was the coldest month, with a mean of 2.9 degrees, making it the 9th coldest December in the past 124 years, and 2.7 degrees colder than the long term average.  While January and February were closer to average, both were about 0.5 degrees colder than normal.


The chart below shows the daily maximum and minimum temperatures at Victoria Gonzales during winter 2021-22, compared with the 30-year averages.  The temperature trend is distinguished by two arctic outbreaks, resulting in a major cold snap in late December, and a second less severe cold snap in late February.  The rest of the winter was fairly close to average.  The warmest day of the winter was recorded on the first day of the season, with a high of 12.7 C on December 1.  

Daily Max & Min Temps at Victoria, winter 2021-22


The December cold snap was one of the most severe in Victoria in recent memory.  The overnight minimum dropped as low as -9.7 C on December 27, which was Victoria's coldest recorded temperature in 36 years.  There were 4 consecutive days when the temperature did not rise above freezing, tied for the 7th longest such streak in the past 124 years in Victoria.  

Victoria Gonzales saw 14 days this winter with overnight lows below freezing, versus the long-term average of 9.6 days.  Eight of these days occurred consecutively, from Dec. 25 to Jan. 1, during the late December cold snap.  A further 5 days occurred consecutively during the late February cold snap.

Victoria received 302 mm of precipitation from December to February, 13% more than the normal winter precipitation of 267 mm.  December and January were both about 25% wetter than normal, but February was slightly drier than normal.  February would have been much drier than normal, if not for 36 mm of rain during the last two days of the month.  Up until Feb. 26, Victoria had received only about 15 mm of rain in February - about 25% of normal.  

Winter 2021-22 saw more days with measurable precipitation than the 30-year average.  There were 55 days with greater than 0.2 mm of precipitation versus the long term average of 46.4 days.  December saw 24 days with precipitation (versus the normal 16.8), January saw 18 days (close to the normal 16.6), and February saw 13 days (right on the normal 13.0 days).  There were also more heavy precipitation days during winter 2021-22 than normal: 5 days with more than 25 mm of precipitation vs. the long range average of 1.5 days.  


The chart below shows daily precipitation during winter 2021-22, and compares the cumulative precipitation with the 30-year average.  The winter was consistently wetter than average until about January 20.  This was followed by about 5 weeks with much drier than normal weather, then finally more heavy rain during the last 2 days of the season.   The wettest day of the winter was January 6, when 33.9 mm fell.  


Daily & Cumulative Precipitation in Victoria, winter 2021-22


The chart below compares the precipitation amounts in Victoria this winter with other locations in the region.  Thanks to the Olympic Mountain rainshadow, Victoria Gonzales is typically much drier than other locations in the region.  However, continuing a recent trend of the past couple of years, the differences were less than normal this winter.  Victoria had 113% of normal winter precipitation, while Victoria Airport had just 94% of normal and Vancouver had only 83% of normal.  Like Victoria, Seattle had above normal precipitation during winter 2021-22.  

  
Winter Precipitation in the Region, 2021-22


Victoria received 30 cm of  snow in winter 2021-22.  That's more than double the normal winter snowfall of 13.8 cm. Half of this winter's snow fell in December (16 cm), and most of the rest (12 cm) fell in January.  Victoria had 10 days this winter with at least 2 cm of snow on the ground.  That's 3 times the normal 3.2 days with snow on the ground.

Overall, winter 2021-22 was  close to normal for sunshine.  December and February were a bit sunnier than normal, while January was a bit cloudier than normal.

The table below shows the number of mostly sunny days (>80% of possible sunshine), partly cloudy days (20-80% of possible sunshine), and mostly cloudy days (<20% of possible sunshine) during winter 2021-22.  Overall, there were close to the normal amount of mostly sunny days, while there were more than average partly cloudy days, and fewer than average mostly cloudy days.  December had fewer than normal sunny days, but more partly cloudy days.  February had more than normal sunny days and fewer than normal mostly cloudy days.


Wednesday, January 5, 2022

2021 was a year of weather extremes in Victoria

2021 was an extraordinary year for weather in Victoria.  Below is a list of just some of the weather extremes experienced in 2021: 

  • All-time hottest temperature ever recorded: 39.8 C on June 28, shattering the old record by almost 4 degrees.
  • Warmest June on record, with mean temperature of 16.6 C.
  • Coldest temperature recorded in 36 years: -9.7 C on December 27.
  • Four consecutive days when the temperature did not rise above freezing (Dec. 26-29) – the longest stretch in 36 years.
  • Biggest range of temperatures ever recorded in one year: 49.5 degrees C.

  • The wettest year on record, with an estimated 953 mm of precipitation.  The old record was 944.6 mm in 1933.  
  • There were 8 days with 25 mm or more precipitation, the most ever recorded at Victoria Gonzales.
  • Wettest meteorological fall (Sept. 1 to Nov. 30), with 510 mm. The rainfall during those 3 months was equal to more than 80% of Victoria’s average annual rainfall.
  • Not one, but two of the 10 all-time wettest days ever recorded in Victoria: 72.6 mm on November 15 (7th wettest) and 71.4 mm on October 28 (9th wettest).
  • Tied for the driest July on record with 0 mm (there have been 6 other Julys with no rainfall).
  • 3rd longest streak with no measurable rain: 53 days from June 15 to August 6.

Truly amazing!

The mean temperature for 2021 (10.6 C) was close to the 30-year average of 10.7 C, but there was a lot of variation during the year.

Six months had higher than normal temperatures (January, April, June, July, August, and November).  June was the warmest on record (16.6 C - a full 2 degrees above normal), while the summer overall was the 6th warmest in 123 years.  On the other hand, six months were cooler than average (February, March, May, September, October, and December).  

The hottest temperature of 2021 - and the hottest temperature ever recorded in Victoria - was on June 28, with a temperature of 39.8 C.  That was about 20 degrees above the normal temperature for the date, and nearly 4 degrees hotter than the previous all-time temperature record for Victoria.  There were 3 days in 2021 with daily maximums above 30 C, compared with the normal of 1.1 days.  There were 15 days with daily maximums above 25 degrees, compared with the average of 9 days.    

The coldest temperature of 2021 was -9.7 C on December 27.  That was the coldest temperature recorded at Victoria Gonzales since November 1985 - more than 36 years.  There were 13 days in 2021 when the temperature went below 0, significantly higher than the long-term average of 9.5 days.  Of those days when temperatures dropped below freezing, 6 occurred consecutively in February, while the other 7 occurred consecutively at the end of December.  Victoria also saw 4 consecutive days when the temperature did nor rise above zero - the longest such stretch since November 1985.

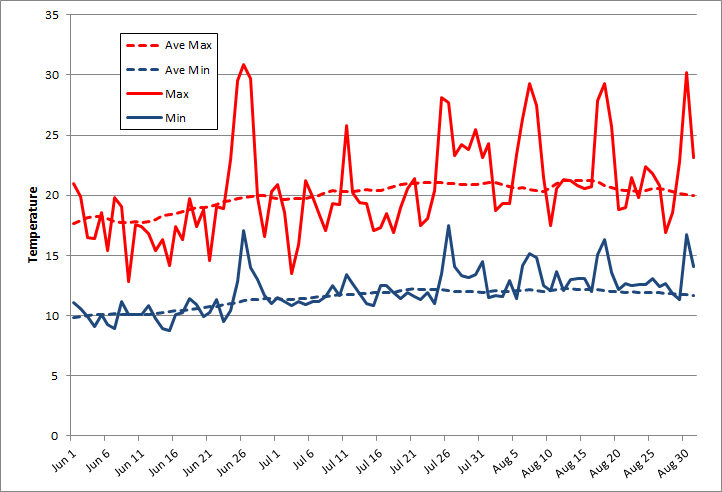
The chart below shows the daily maximum and minimum temperatures at Victoria Gonzales in 2021, compared with the long-term normal temperatures.  The most prominent variations from normal were the heat wave in late June and the cold snap in late December.  As a result of these extreme events, Victoria Gonzales experienced its largest range of temperatures ever recorded in a single year in 2021 - a range of 49.5 degrees between the 39.8 C on June 28 and the -9.7 C on December 27.  The average temperature range in Victoria is about 35 degrees, while the old record was 45.6 degrees in 1968.


2021 was the wettest year on record at Victoria Gonzales, with an estimated 953 mm of precipitation, 45% more than the long-term average of 656 mm.  The old record was 944.6 mm in 1933.  The record rain in 2021 followed 2020, which at the time was the wettest year in 20 years in Victoria, with 837 mm.   The fall was especially wet, in fact it was the wettest fall on record in Victoria, with 510 mm of rain from September 1 to November 30.  Victoria saw 633 mm - an entire year's worth of precipitation - in the last 4 months of the year.

The chart below shows daily and cumulative precipitation at Victoria Gonzales for 2021.   It was really only in the last 4 months of the year that precipitation was much above average.  In fact, the summer was the 6th driest on record, with just 16 mm of rain from June 1 to September 30.  This included a 53-day streak with no measurable precipitation from June 15 to August 6 - the third longest dry streak on record in Victoria. 


There were 145 days with measurable precipitation in 2021, compared with the normal of 132 days.  There were two days in 2021 that were among the 10 wettest days ever recorded in Victoria: 72.6 mm on November 15 and 71.4 mm on October 28.  There were 8 days with more than 25 mm of rain in 2021, the most on record at the Victoria Gonzales location, and far higher than the average of 2.9 days annually.  

The chart below compares annual precipitation at Victoria Gonzales in 2021 with other locations in the region.  Thanks to its rainshadow location, Victoria is typically drier than most other locations, and while that was still the case in 2021, the difference was not as much as it usually is.  That's because precipitation at Victoria Gonzales was 45% above normal in 2021, while it was just 8% above normal at the Victoria Airport (in North Saanich) 4%  above normal in Vancouver, and 11% above normal in Seattle.  Looking at this another way, the Victoria Airport typically receives more than 36% more precipitation than Victoria Gonzales, but in 2021 it got just 1% more.


Comparison of Annual Precipitation in 2021

Victoria received 44 cm of snow in 2021, nearly triple the average of 16 cm.  2021 was the snowiest year in Victoria since 1996.  There was 28 cm of snow in February, and a further 16 cm in December.  There were 10 days in 2021 with at least 2 cm of snow on the ground, 4 in January and 6 in December.  That is nearly 3 times the annual average of 3.5 days with snow on the ground.


Sunshine was slightly above average in Victoria in 2021 thanks to above average sunshine in June and July, as well as in March and April.  On the other hand, the fall months were cloudier than normal.  

The table below shows the distribution of mostly sunny, partly cloudy, and mostly cloudy days in 2021. There were 123 mostly sunny days, slightly above the average of 121.  There were 139 partly cloudy days compared with the average 132 days.  Finally, there were 103 mostly cloudy days, fewer than the average of 113 days.


Thursday, December 30, 2021

Fall 2021: the wettest on record in Victoria

 Meteorological fall is from September 1 to November 30.  After a hot, dry summer, fall 2021 was the wettest on record at Victoria Gonzales.  Temperatures were close to average.

The mean fall temperature at Victoria Gonzales was 11.0 degrees, which is just slightly (0.2 degrees) below the 30-year average.  September and October saw below average temperatures, while November was warmer than average.

The chart below shows the daily maximum and minimum temperatures at Victoria Gonzales during fall 2021, compared with the 30-year averages.  The most significant variation from normal, was a period of cooler than average temperatures during the first half of October.  November was generally warmer than average.  The warmest temperature was 25.7 C on September 7.  The coldest temperature was 1.9 C on November 17.  

Daily Max & Min Temperatures in Victoria, fall 2021

Victoria received 510 mm of rain from September to November, making it the wettest fall on record at Victoria Gonzales.  That was more than double the 30-year average fall rainfall of 227 mm.  The old record was 444 mm in 1995.   All three months had higher than normal rainfall. 

Victoria had 55 days with measurable rainfall this fall, well above the normal 37.8 days.  There were 12 days with measurable rainfall in September (normal 7.8), 20 in October (normal 12.8), and 23 in November (normal 17.4).


The chart below shows daily precipitation during fall 2021, and compares the cumulative precipitation with the 30-year average.   Almost the entire fall was wetter than normal.  In addition the being the wettest fall on record, fall 2021 also saw 2 of the 10 wettest days ever recorded in Victoria: 72.6 mm on November 15 (7th wettest day on record) and 71.4 mm on October 28 (9 wettest day on record).

Daily & Cumulative Precipitation in Victoria, fall 2021


Wednesday, September 1, 2021

Summer 2021 was warmer, drier, and sunnier than normal in Victoria

Meteorological summer consists of June, July, and August.  Summer 2021 brought extraordinary 1 in 1,000 year heat in June, and a long dry spell from mid-June to August.  Overall, the summer was warmer, drier, and sunnier than normal this year in Victoria.  

The mean temperature this past summer at Victoria Gonzales was 16.5 degrees, which is 0.7 degrees above the 30-year average.  Summer 2021 was the 5th warmest in Victoria since record-keeping began at Gonzales Observatory in 1914.  June was the warmest on record in Victoria - 2 full degrees above normal, July was close to normal, and August was about 0.4 degrees above normal.

The chart below shows the daily maximum and minimum temperatures at Victoria Gonzales during summer 2021, compared with the 30-year averages.  What immediately stands out is the extraordinary heat wave in late June, when temperatures reached 39.8 C at Victoria Gonzales, beating the old all-time temperature record by nearly 4 degrees.  Climatologists estimated this to be a 1 in 1,000 year event for our region.  

There were 3 other more typical Victoria heat waves during the summer, lasting only a day or two and with temperatures reaching 28 C at the beginning of June, 29 C in mid-June, and just shy of 30 C in mid-August.  For the rest of the summer, temperatures were fairly close to the average.  Overall, the average daily high temperature this summer was 21.1 C (versus the normal of 20.0 C) while the average daily minimum was 12.0 C (normal 11.5 C).  Other locations in the region, away from the cooling effects of the Strait of Juan de Fuca, had significantly warmer average daytime highs.  For example, the average daily high temperature this summer at the University of Victoria was 24.0 C (compared with the normal of 22.6 C). 

Victoria Gonzales averages 38 days each summer when the temperature exceeds 20 C, but for summer 2021 there were 49 such days.  Similarly, there were 14 days above 25 C in summer 2021, double the average of 7.  There were 3 days when the temperature exceeded 30 C (all during the June heat wave), compared with the average of 1.1 days.  

Daily Max & Min Temperature at Victoria Gonzales, Summer 2021


Victoria received 16 mm of rain from June to August, which is just over one third of the normal for its summer rainfall of 47 mm. June and August saw about half of normal rainfall, while there was no measurable rain during July (the 7th time this has happened).  

Victoria had 7 days with measurable rainfall this summer, just under half of the normal 14.8 days.  There were 5 days with measurable rain in June, none in July, and 2 in August.  There was no measurable rainfall from June 15 to August 6 - a total of 53 days, making it the third longest such stretch since 1914.  By comparison, the average summer drought period over the past 30 years has been 26 days.


The chart below shows daily precipitation during summer 2021, and compares the cumulative precipitation with the 30-year average.   The first half of June was fairly close to normal, but this was followed by that 53 day stretch with no measurable rain.  The rainfall that broke the drought, 5 mm on August 7, was also the wettest day of the entire summer.

Daily & Cumulative Rainfall at Victoria Gonzales, Summer 2021


The chart below compares the rainfall amounts in Victoria this summer with other locations in the region.  As is typically the case, Victoria Gonzales had the lowest amount, with a total of 16 mm.  The Victoria Airport received almost 41 mm - more than 2.5 times as much as Victoria Gonzales, mostly due to higher rainfall in June.  Vancouver received 82 mm - more than 5 times as much as Victoria (Vancouver typically receives about 3 times as much rain in the summer as Victoria).  Seattle received 51 mm - more than 3 times Victoria's rainfall.  While Victoria only received about one third of its normal summer rainfall this year, the other locations received between 57% and 67% of normal.  Note that none of the locations received any significant rainfall in July (Vancouver received 0.5 mm while the other locations had no measurable rain).  

Rainfall in Victoria and the Region, Summer 2021

Summer 2021 was sunnier than normal.  June and July were both sunnier than normal, while August was slightly cloudier than normal.  Summer 2021 was the 5th sunniest recorded in Victoria (after 1951, 1958, 2018, and 1961).  It was sunny 73% of daylight hours this summer ( and 82% of daylight hours in July).

The table below shows the number of mostly sunny days (>80% of possible sunshine), partly cloudy days (20-80% of possible sunshine), and mostly cloudy days (<20% of possible sunshine).  There were 57 mostly sunny days this summer compared with the normal of 45 days.  Conversely, there were only 5 mostly cloudy days, compared with the normal of 12 days.