Tuesday, February 16, 2016

A very rainy day in Victoria!

Up until Sunday, it had been a dry start to the year, with just 81 mm since January 1, compared with our normal of 134 mm in the first 45 days of the year.  Then came yesterday (February 15) - what a very rainy day!  There was 61.6 mm of rain recorded at Victoria Gonzales.    Average rainfall for the entire month of February is 61 mm, so that's a month's worth of rain in one day.  It was also far more than the 47 mm of rain we had in the entire month of January 2016, even though we had 20 days with measurable precipitation during that month.  Yesterday's rainfall was quite rare for Victoria.  It certainly blew away the old record for the date of 28.2 mm of rain back in 1949.  It was the most rain recorded at Victoria Gonzales in a single day since since November 6, 2006 - more than 9 years ago.  It was also the second rainiest February day ever recorded at Victoria Gonzales in more than 117 years of recording-keeping, and the 17th rainiest day ever recorded in any month!  On average, Victoria gets a day like yesterday with more than 60 mm of rain only once ever 7 years.

As the chart below shows, yesterday's rain completely closed the rain deficit we'd had so far this year.  The blue line shows the 30-year average rainfall to date while the red line shows the cumulative total rainfall for 2016.  You can see that we've been well below average so far this year, but with yesterday's deluge, we have jumped to just above average.  The green bars show the daily rainfall amounts, and you can see how much rainier yesterday was compared with any other day this year.


Why did we get so much rain?  There were two factors.  The first was an atmospheric river or "pineapple express" carrying subtropical moisture directly to our area.  Usually during a pineapple express, as the moisture streams in from the southwest, Victoria is protected by the rain shadow of the Olympic Mountains, and our rainfall totals are a lot less than areas to the north and west of us.  However, this pineapple express, rather than coming from the southwest, was coming from a more westerly direction.  When that happens, the rain shadow shifts from being northeast of the Olympics (and usually including Victoria) to be more east of the Olympics (giving more protection to Seattle).  Westerly flows are often when Victoria will get it's heaviest rainfall.   When I saw in the forecast on Sunday that there was going to be an atmospheric river coming at us from the west, I expected we'd get more than our usual light showers!

Below is an interesting radar image from about noon yesterday.  Instead of being in the hole of the donut, as we often are, Victoria is right in the bulls eye!


Saturday, February 13, 2016

February blahs? Not in Victoria!

You often hear the term February blahs, especially from people in other parts of Canada who are tired of the cold, snow and slush, and they know that they probably have a couple more months of winter to endure.  I think this is the time of year when I am most appreciative of living in Victoria.  This may not be the nicest time of year in Victoria, but compared with most of the rest of Canada, it is heaven.  (It was -26 degrees in Toronto this morning, although granted that is very cold even for them!)


versus


As I mentioned in this post, while February is still the depth of winter in many parts of Canada, the coldest and dreariest point of the winter in Victoria tends to happen quite early, around the end of December.  By February, the weather is noticeably warmer, drier, and sunnier.  The average high temperature in February in Victoria is 9 degrees, a degree warmer than January and nearly two degrees warmer than December.

February is also noticeably drier, with an average of just 61 mm of precipitation compared with more than 100 mm each month in November, December, and January - the end of the rainy season is definitely in sight!  On average, there is a 43% chance of measurable precipitation on any given day in February (compared with than 50% in November, December, and January).  As I've said before, I think looking at the % chance of rain on any given day somewhat overstates how rainy it is, since a day with measurable precipitation doesn't necessarily mean rain all day - it could be a brief shower.  Another way to look at at this is the % of hours with measurable precipitation, and for Victoria in February there is precipitation just 19% of the time.

The sun is also making more of an appearance, with 98 hours of sunshine in a typical February in Victoria.  That works out to an average of 3.5 hours per day, compared with only 2.3 hours per day in January and 2.0 hours per day in December.  On average, February gets 22 days with at least some measurable sunshine, and overall, it is sunny about 35% of the time (at least during daylight hours!).  In other words, during daylight hours it's actually more likely for the sun to be shining February (35% of the time) than it is to be raining (19% of the time).

Snow is also pretty rare in February in Victoria.  Over the past 30 years, only 11 Februarys have seen any snow at all and just 5 of the past 30 Februarys saw significant snowfall (more than 10 cm).  When it does snow, it melts quickly; Victoria averages just 0.7 days with snow on the ground during February.

The other nice thing about February is that it's springtime!  Crocuses, daffodils, and rhodos are blooming, and the cherry blossoms are out.  Sometimes when we have mild weather in February, they will also get warm weather in Southern Alberta, with temperatures in the teens.  While that must be a nice break from the cold and the snow, it's so much nicer to enjoy the mild weather here when there is greenery and flowers everywhere!  Here's a few photos I took last week (February 8) around Victoria:

Rhododendrons at Beacon Hill Park

Camelias
Irises

Even the bees are out


Finally, here is a link to a great video that really sums up how nice February can be in Victoria.


Saturday, February 6, 2016

Climate change on the B.C. coast: What is the long term temperature trend in Victoria?

We've talked a lot about the current climate in Victoria, mostly using the most recent 30-year average (1981-2010).  Today, I'd like to look at the longer term picture.  How has the climate changed over time?  Luckily, in Victoria we are very well placed to look at long term trends thanks to the very long period of record at the Victoria Gonzales weather site.  It's  been gathering weather data since 1898 - nearly 118 years - making it the longest such record in B.C. and one of the longest on the west coast of North America.

Let's start by looking at the trend in mean annual temperature - the average of all high and low temperatures for the entire year.  In the chart below, the solid red  line shows the annual mean temperature for each year from 1899 to 2015, while the dashed blue line is the mean temperature for the entire period - 10.2 degrees.  The mean temperature has ranged from 8.6 degrees in 1916, the coolest year, to 11.7 degrees in 2015, the warmest year.  Clearly, there is a lot of variability from year to year, which makes it difficult to see the longer term trends.


To make it a little easier to see the longer term changes, the next chart uses a rolling ten-year average.  The first point on this chart is the average for 1899-1900, the next point is 1900-1910, and so on.  This smooths out the yearly fluctuations and you can start to see the trends.  One thing you'll notice is that the temperature appears to have fluctuated between warmer and cooler periods.  For example, it was generally much cooler than average in the 1910s and early 1920s.  This was followed by a warmer than average period in the 1930s and 1940s.  There was generally a cooler period again in the 1960s and 1970s, but then it became much warmer once again in the 1990s and 2000s.  One thing to note is that the cooler period in the 1960s and 1970s wasn't as cool as the earlier cool period, while the warmer period in recent decades has been warmer than the last warm period in the 1930s and 1940s.  So underlying these decadal fluctuations, there does seem to be an overall longer term warming trend.


This pattern is likely caused at least in part by the Pacific Decadal Oscillation (PDO).  This is a long term fluctuation in the temperature of the North Pacific Ocean which also leads to atmospheric changes that affect our weather.  In some ways, it is similar to El Nino, but whereas the cycle between El Ninos is usually a few years, the PDO cycle is more like 20-30 years.  Over the past century, the PDO was in a cool phase until about 1925, then a warm phase during 1925-47, followed by a cool phase during 1947-77, and then a warm phase during 1977-2007.  The chart below shows the PDO Index over this period.  You can see that it matches quite closely with the longer term temperature swings we've observed in Victoria.


In order to see the long range trend more clearly, the chart below uses a rolling 30-year average temperature.  The first point on this chart is the 1899-1929 average, the second point is the 1900-1930 average, etc. with the last point being 1985-2015.  Just as the 10-year rolling average smoothed out the year to year fluctuations, the 30-year rolling average smooths out some of the decadal fluctuations.  Now you can see that there has indeed been a long term warming trend, particularly over the past 40 years.  During this time, the 30-year average temperature has increased from 9.9 degrees for 1947-77 to 10.7 degrees for 1985-2015, so roughly a 0.8 degree warming.  That may not be as much warming as some other locations have experienced - the B.C. coast and the U.S. Pacific Northwest have generally seen less warming from global warming than other regions - but a 0.8 degree increase in a 30-year average temperature is very significant.


Interestingly, the amount of warming has varied quite significantly depending on which month you look at.  For example, there has been virtually no change in 30-year average temperatures during both September and December.  By contrast, Januarys have become much warmer, rising from a 1949-79 mean of 3.8 degrees to a 1985-2015 mean of 5.7.  That 1.9 degree rise over the past 40 years is more than double the increase in the annual temperature.  As a result, January has gone from being the coldest month of the year in Victoria to the second coldest, after December.

Another way to examine the warming trend is to look at extreme temperatures.  For example, Victoria recorded low temperatures  below -10 degrees in 19 winters during the period between 1898 and 1990 - about once every 5 winters.  However, the last time Victoria had a temperature below -10 was December 1990, meaning we have now experienced 25 winters in a row without getting down that cold.  Even temperatures below freezing are becoming much less common.  For the 1949-79 period, there was an average of 19 days each year with overnight lows below 0.  For the most recent 30-year period, that has dropped to an average of just 10 days each winter.

We can also look at the trend in annual snowfall as a surrogate for temperature.  The chart below shows the trend in 30-year average seasonal snowfall in Victoria.  You can see that it peaked in the 1950s and 1960s during the cold phase of the POD, but has declined significantly since then, dropping from more than 35 cm annually down to around 20 cm annually for the most recent 30-year period.


Wednesday, February 3, 2016

Another Rain Shadow

Continuing our pattern from January, we had another good rain shadow today.  Here's the radar from about 4:30 this afternoon:


The rain shadow seems quite strong.  Sometimes only the very southeastern part of Victoria is in the rain shadow, but this one is extending out west towards Sooke and north towards Sidney.

A look at the daily rainfall totals as of 6 pm:

0 mm at most sites in Victoria, Esquimalt, Oak Bay and Saanich
0.5 mm in Sidney
6 mm in Sooke
8 mm in Duncan
16 mm in  Ladysmith
18-20 mm at most sites in Nanaimo

But as a write this, I can hear a few drops of rain starting to fall.  Here's the latest radar, from just before 6 pm:


It looks like the rain may starting to move in.  It was nice while it lasted!

Monday, February 1, 2016

A dry and mild January in Victoria

It’s February 1, and time for a look back at the weather for January 2016. 

The most notable feature about the weather this past January was the low total rainfall – just 47 mm compared with the 1981-2010 average of 104 mm of precipitation at Victoria Gonzales, making it the tenth driest January in 118 years of record keeping.  It may surprise you that January was so dry.  That may be because the number of days with measurable precipitation was actually slightly above average - 20 days this January versus 19 on average - but the rainfall amounts on those rainy days was significantly lower than normal.  

I’ve talked previously about the effect of the Olympic Mountain rain shadow in reducing the amount of precipitation over Victoria, and January was a prime example of that.  There were numerous days in January when there was heavy rain to the north and west, but Victoria received just a few sprinkles.  For example, the Victoria Airport – 25 km north of Victoria and outside the Olympic rain shadow – received 138 mm of precipitation in January, quite close to its normal of 143 mm.  Total precipitation amounts at the other Environment Canada weather sites in the Victoria region include 54 mm at the University of Victoria  and 75 mm at Esquimalt Harbour (which is further west and gets less rain shadowing).  

I thought it would be interesting to look in a bit more detail at the variation in rainfall around the region in January.  Victoria's School Based Weather Station Network has dozens of weather sites in the Victoria region, so I have used statistics from those sites in the chart below, which compares the January 2016 precipitation total at various sites around Greater Victoria.  You can see the impact of the rain shadow, especially in the southern and eastern sections of the region.  Some of the wetter locations in the region received nearly four times the precipitation in January than Victoria Gonzales.  


Perhaps I will try to create a map to show this at some point!

It’s also interesting to compare Victoria's January 2016 precipitation with other locations outside Greater Victoria.  As the chart shows, Pender Island (one of the drier locations on the Gulf Islands) got about 2.5 times as much rain as Victoria.  Nanaimo and Seattle both got about 4 times as much rain, while Vancouver and Courtenay received nearly 4.5 times as much rain.  Out on the exposed west coast of Vancouver Island, Ucluelet received a whopping 429 mm of rain - nearly ten times Victoria's total.  Thank you rain shadow!


There was no snowfall in Victoria during January, although some outlying areas did receive a dusting of snow.  For example, there was 3 cm of snow recorded at the Victoria Airport.  The last time Victoria received significant snowfall was January 2012.

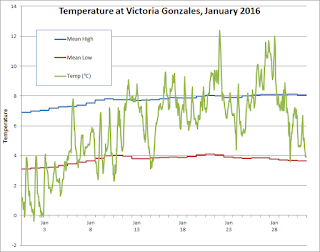
Temperatures in January were a little above the average.  At Victoria Gonzales, the average daily high for the month was 8.1 degrees and the average daily low was 4.4, resulting in a mean monthly temperature of 6.2 degrees. That compares with the 1981-2010 average of 5.9 degrees.  The chart below compares the actual temperature trend (in green) with the average daily highs and lows for January.   The month started well below average, then gradually increased, reaching above average temperatures for most of the second half of the month.  The milder temperatures are consistent with an El Nino year, although it wasn’t as warm as during past El Nino years when the January temperature has averaged 6.8 degrees, as I discussed here.  The warmest recorded temperature during the month was 12.8 on January 22  and the coldest recorded temperature was -0.5 on January 2.  There were 3 days (the first three days of the month) with temperatures below freezing, which was close to the average of 3.4 days. 


One note on the Victoria Gonzales precipitation total.  The Environment Canada weather site at Gonzales was missing precipitation data for some days in January 2016.  Luckily, there are two Victoria School Based Weather Stations  within 500-600 m of Gonzales: Margaret Jenkins Elementary and SMU.  I used an average of these two sites to fill in the missing data for Victoria Gonzales.